

estimation and inverse models are used marginally for this task (Fig. 3.15). It is
worth to mention that one third of the answers report the combined use of more than
one methodology.
The most frequent activity sectors/source categories identified in the studies are
combustion in the energy sector and road transport (more than 70 % of the studies),
followed by combustion in industry, non-industrial combustion and agriculture.
Interestingly, many of the studies (40 %) focus only on one single activity
0%
10%
20%
30%
40%
50%
60%
70%
AQP (34 answers)
RP (23 answers)
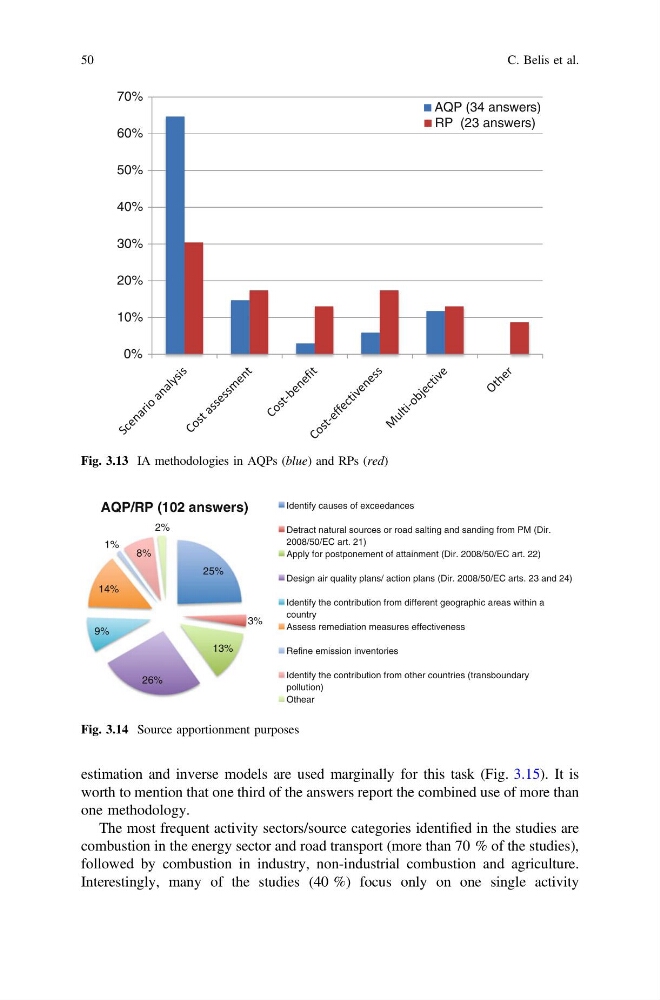
Fig. 3.13 IA methodologies in AQPs (blue) and RPs (red)
25%
3%
13%
26%
9%
14%
1%
8%
2%
AQP/RP (102 answers)
Identify causes of exceedances
Detract natural sources or road salting and sanding from PM (Dir.
2008/50/EC art. 21)
Apply for postponement of attainment (Dir. 2008/50/EC art. 22)
Design air quality plans/ action plans (Dir. 2008/50/EC arts. 23 and 24)
Identify the contribution from different geographic areas within a
country
Assess remediation measures effectiveness
Refine emission inventories
Identify the contribution from other countries (transboundary
pollution)
Othear
Fig. 3.14 Source apportionment purposes
50
C. Belis et al.
worth to mention that one third of the answers report the combined use of more than
one methodology.
The most frequent activity sectors/source categories identified in the studies are
combustion in the energy sector and road transport (more than 70 % of the studies),
followed by combustion in industry, non-industrial combustion and agriculture.
Interestingly, many of the studies (40 %) focus only on one single activity
0%
10%
20%
30%
40%
50%
60%
70%
AQP (34 answers)
RP (23 answers)
Fig. 3.13 IA methodologies in AQPs (blue) and RPs (red)
25%
3%
13%
26%
9%
14%
1%
8%
2%
AQP/RP (102 answers)
Identify causes of exceedances
Detract natural sources or road salting and sanding from PM (Dir.
2008/50/EC art. 21)
Apply for postponement of attainment (Dir. 2008/50/EC art. 22)
Design air quality plans/ action plans (Dir. 2008/50/EC arts. 23 and 24)
Identify the contribution from different geographic areas within a
country
Assess remediation measures effectiveness
Refine emission inventories
Identify the contribution from other countries (transboundary
pollution)
Othear
Fig. 3.14 Source apportionment purposes
50
C. Belis et al.