

119
should also be explored and, if necessary, de novo collections of crop yields made.
Such data collection should ideally be on a subnational basis, since changing patterns of production can be site-specific. Our analysis of FAOSTAT data should,
therefore, only be considered as an exploratory starting point.
0
3
5
6
7
8
9
3 0.094
5 0.088 -0.186
6 0.308 -0.319 -0.075
7 -0.056 0.118 0.015 0.036
8 -0.203 0.076 0.044 0.377 0.064
9 -0.135 -0.248 0.129 0.277 0.580 -0.146
10 0.029 0.148 0.049 0.125 -0.045 0.049 0.088
0
1
2
3
4
5
6
7
9
1 -0.247
2 -0.606 -0.759
3 0.116 0.070 -0.021
4 -0.334 0.079 -0.036 -0.100
5 -0.068 0.054 -0.003 -0.002 -0.001
6 0.184 -0.206 0.059 -0.884 -0.362 -0.018
7 0.098 0.214 0.043 -0.038 -0.090 0.000 -0.013
9 0.561 0.190 0.023 -0.623 0.294 0.497 -0.023 -0.107
10 -0.042 -0.145 -0.014 0.012 0.087 0.388 0.012 0.528 0.020
0 Cashew nuts (with shell)
1 Chickpeas
2 Coconuts
3 Coffee (green)
4 Groundnuts (with shell)
5 Maize
6 Mangoes, mangosteens, guavas
7 Millet
8 Oranges
9 Potatoes
10 Sorghum
A) Kenya
B) Tanzania
Positive correlations (P ≤ 0.05)
Negative correlations (P ≤ 0.05)
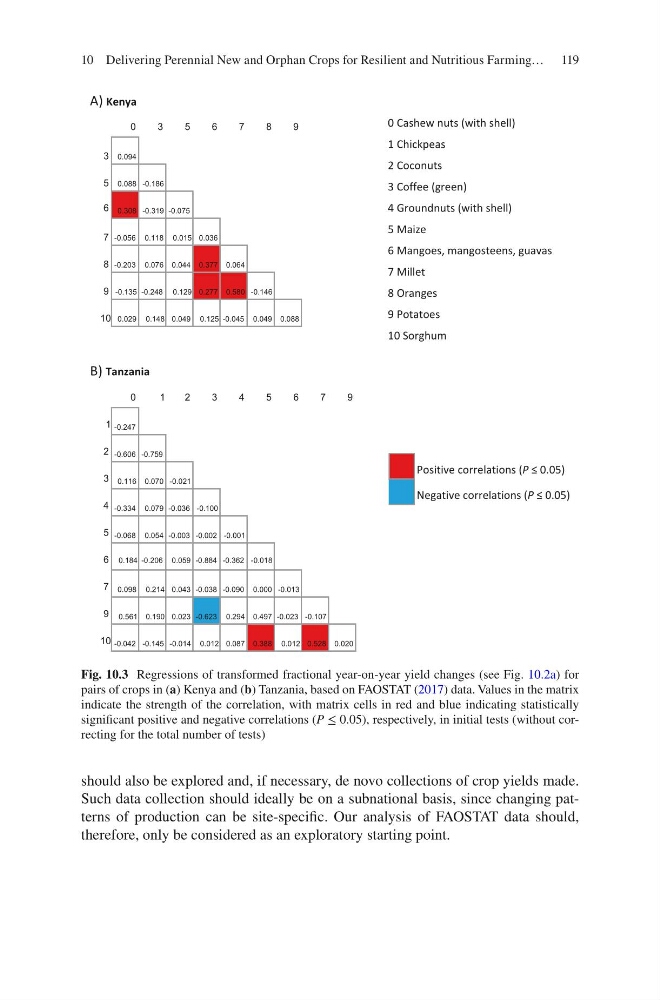
Fig. 10.3 Regressions of transformed fractional year-on-year yield changes (see Fig. 10.2a) for
pairs of crops in (a) Kenya and (b) Tanzania, based on FAOSTAT (2017) data. Values in the matrix
indicate the strength of the correlation, with matrix cells in red and blue indicating statistically
significant positive and negative correlations (P ≤ 0.05), respectively, in initial tests (without correcting for the total number of tests)
10 Delivering Perennial New and Orphan Crops for Resilient and Nutritious Farming…
should also be explored and, if necessary, de novo collections of crop yields made.
Such data collection should ideally be on a subnational basis, since changing patterns of production can be site-specific. Our analysis of FAOSTAT data should,
therefore, only be considered as an exploratory starting point.
0
3
5
6
7
8
9
3 0.094
5 0.088 -0.186
6 0.308 -0.319 -0.075
7 -0.056 0.118 0.015 0.036
8 -0.203 0.076 0.044 0.377 0.064
9 -0.135 -0.248 0.129 0.277 0.580 -0.146
10 0.029 0.148 0.049 0.125 -0.045 0.049 0.088
0
1
2
3
4
5
6
7
9
1 -0.247
2 -0.606 -0.759
3 0.116 0.070 -0.021
4 -0.334 0.079 -0.036 -0.100
5 -0.068 0.054 -0.003 -0.002 -0.001
6 0.184 -0.206 0.059 -0.884 -0.362 -0.018
7 0.098 0.214 0.043 -0.038 -0.090 0.000 -0.013
9 0.561 0.190 0.023 -0.623 0.294 0.497 -0.023 -0.107
10 -0.042 -0.145 -0.014 0.012 0.087 0.388 0.012 0.528 0.020
0 Cashew nuts (with shell)
1 Chickpeas
2 Coconuts
3 Coffee (green)
4 Groundnuts (with shell)
5 Maize
6 Mangoes, mangosteens, guavas
7 Millet
8 Oranges
9 Potatoes
10 Sorghum
A) Kenya
B) Tanzania
Positive correlations (P ≤ 0.05)
Negative correlations (P ≤ 0.05)
Fig. 10.3 Regressions of transformed fractional year-on-year yield changes (see Fig. 10.2a) for
pairs of crops in (a) Kenya and (b) Tanzania, based on FAOSTAT (2017) data. Values in the matrix
indicate the strength of the correlation, with matrix cells in red and blue indicating statistically
significant positive and negative correlations (P ≤ 0.05), respectively, in initial tests (without correcting for the total number of tests)
10 Delivering Perennial New and Orphan Crops for Resilient and Nutritious Farming…