

120
10.4 What Measures Are Needed to Drive Perennial NOC
Integration into Eastern and Southern African Food
Systems?
As illustrated above, analyses of the timings of food production in crop portfolios,
and of FAOSTAT data sets, support the role that perennial crops, including perennial NOC, can play in supporting resilient, nutritious food systems in eastern and
southern Africa at subnational and country levels. This is provided proper consideration is also given to crop features such as reproductive mechanisms and nutritional
compositions. In common with production systems globally, however, there is an
increasing reliance on less diverse and less nutritious foods in the region, with most
research efforts focused on a few major annual crops (Khoury et al. 2014). This is
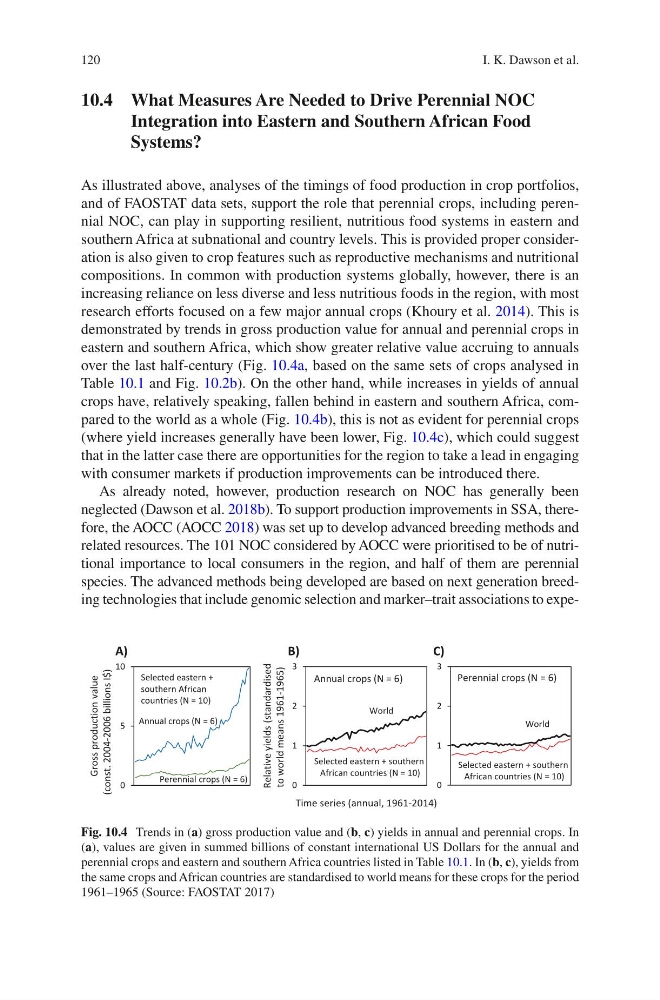
demonstrated by trends in gross production value for annual and perennial crops in
eastern and southern Africa, which show greater relative value accruing to annuals
over the last half-century (Fig. 10.4a, based on the same sets of crops analysed in
Table 10.1 and Fig. 10.2b). On the other hand, while increases in yields of annual
crops have, relatively speaking, fallen behind in eastern and southern Africa, compared to the world as a whole (Fig. 10.4b), this is not as evident for perennial crops
(where yield increases generally have been lower, Fig. 10.4c), which could suggest
that in the latter case there are opportunities for the region to take a lead in engaging
with consumer markets if production improvements can be introduced there.
As already noted, however, production research on NOC has generally been
neglected (Dawson et al. 2018b). To support production improvements in SSA, therefore, the AOCC (AOCC 2018) was set up to develop advanced breeding methods and
related resources. The 101 NOC considered by AOCC were prioritised to be of nutritional importance to local consumers in the region, and half of them are perennial
species. The advanced methods being developed are based on next generation breeding technologies that include genomic selection and marker–trait associations to expe0
5
10
0
1
2
3
Annual crops (N = 6)
0
1
2
3
Perennial crops (N = 6)
World
World
Time series (annual, 1961-2014)
Relative yields (standardised
to world means 1961-1965)
B)
C)
Selected eastern + southern
African countries (N = 10)
Selected eastern + southern
African countries (N = 10)
Selected eastern +
southern African
countries (N = 10)
Annual crops (N = 6)
Perennial crops (N = 6)
Gross production value
(const. 2004-2006 billions I$)
A)
Fig. 10.4 Trends in (a) gross production value and (b, c) yields in annual and perennial crops. In
(a), values are given in summed billions of constant international US Dollars for the annual and
perennial crops and eastern and southern Africa countries listed in Table 10.1. In (b, c), yields from
the same crops and African countries are standardised to world means for these crops for the period
1961–1965 (Source: FAOSTAT 2017)
I. K. Dawson et al.
10.4 What Measures Are Needed to Drive Perennial NOC
Integration into Eastern and Southern African Food
Systems?
As illustrated above, analyses of the timings of food production in crop portfolios,
and of FAOSTAT data sets, support the role that perennial crops, including perennial NOC, can play in supporting resilient, nutritious food systems in eastern and
southern Africa at subnational and country levels. This is provided proper consideration is also given to crop features such as reproductive mechanisms and nutritional
compositions. In common with production systems globally, however, there is an
increasing reliance on less diverse and less nutritious foods in the region, with most
research efforts focused on a few major annual crops (Khoury et al. 2014). This is
demonstrated by trends in gross production value for annual and perennial crops in
eastern and southern Africa, which show greater relative value accruing to annuals
over the last half-century (Fig. 10.4a, based on the same sets of crops analysed in
Table 10.1 and Fig. 10.2b). On the other hand, while increases in yields of annual
crops have, relatively speaking, fallen behind in eastern and southern Africa, compared to the world as a whole (Fig. 10.4b), this is not as evident for perennial crops
(where yield increases generally have been lower, Fig. 10.4c), which could suggest
that in the latter case there are opportunities for the region to take a lead in engaging
with consumer markets if production improvements can be introduced there.
As already noted, however, production research on NOC has generally been
neglected (Dawson et al. 2018b). To support production improvements in SSA, therefore, the AOCC (AOCC 2018) was set up to develop advanced breeding methods and
related resources. The 101 NOC considered by AOCC were prioritised to be of nutritional importance to local consumers in the region, and half of them are perennial
species. The advanced methods being developed are based on next generation breeding technologies that include genomic selection and marker–trait associations to expe0
5
10
0
1
2
3
Annual crops (N = 6)
0
1
2
3
Perennial crops (N = 6)
World
World
Time series (annual, 1961-2014)
Relative yields (standardised
to world means 1961-1965)
B)
C)
Selected eastern + southern
African countries (N = 10)
Selected eastern + southern
African countries (N = 10)
Selected eastern +
southern African
countries (N = 10)
Annual crops (N = 6)
Perennial crops (N = 6)
Gross production value
(const. 2004-2006 billions I$)
A)
Fig. 10.4 Trends in (a) gross production value and (b, c) yields in annual and perennial crops. In
(a), values are given in summed billions of constant international US Dollars for the annual and
perennial crops and eastern and southern Africa countries listed in Table 10.1. In (b, c), yields from
the same crops and African countries are standardised to world means for these crops for the period
1961–1965 (Source: FAOSTAT 2017)
I. K. Dawson et al.