

118
-0.6
-0.3
0
0.3
0.6
Kenya (4 A, 4 P)
1 Millet (A), 2 Sorghum (A)
-0.6
-0.3
0
0.3
0.6
Sudan (Sudan + South Sudan) (5 A, 2 P)
1 Chick peas (A), 2 Millet (A)
-0.6
-0.3
0
0.3
0.6
Tanzania (6 A, 4 P)
1 Cashew nuts (with shell) (P), 2 Maize (A)
Log
10 fraction of yield (year-on-year)
-0.3
Cashew nuts (with shell) (A)
Chick peas (A)
Coconuts (P)
Coffee (green) (P)
Dates (P)
Groundnuts (with shell) (A)
Maize (A)
Mangoes, mangosteens, guavas (P)
Millet (A)
Oranges (P)
Potatoes (A)
Sorghum (A)
0
0.1
0.2
Annual crops (N = 6)
Perennial crops (N = 6)
Deviations log
10 fractions of
yields (year-on-year)
Time series (annual, 1962/1961 -2014/2013)
Selected eastern + southern African countries (N = 10)
A)
B)
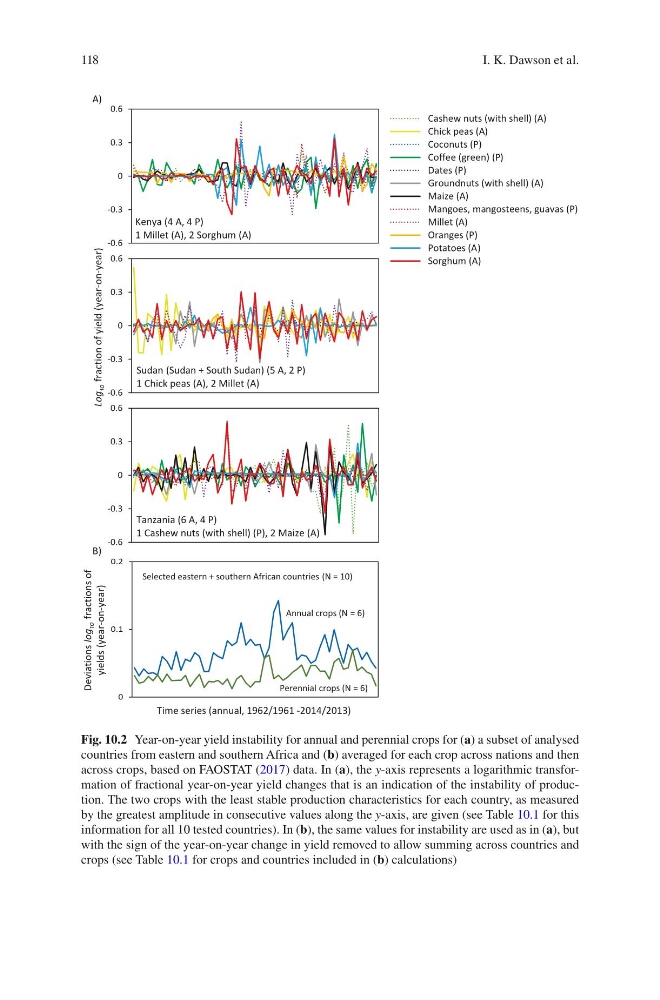
Fig. 10.2 Year-on-year yield instability for annual and perennial crops for (a) a subset of analysed
countries from eastern and southern Africa and (b) averaged for each crop across nations and then
across crops, based on FAOSTAT (2017) data. In (a), the y-axis represents a logarithmic transformation of fractional year-on-year yield changes that is an indication of the instability of production. The two crops with the least stable production characteristics for each country, as measured
by the greatest amplitude in consecutive values along the y-axis, are given (see Table 10.1 for this
information for all 10 tested countries). In (b), the same values for instability are used as in (a), but
with the sign of the year-on-year change in yield removed to allow summing across countries and
crops (see Table 10.1 for crops and countries included in (b) calculations)
I. K. Dawson et al.
-0.6
-0.3
0
0.3
0.6
Kenya (4 A, 4 P)
1 Millet (A), 2 Sorghum (A)
-0.6
-0.3
0
0.3
0.6
Sudan (Sudan + South Sudan) (5 A, 2 P)
1 Chick peas (A), 2 Millet (A)
-0.6
-0.3
0
0.3
0.6
Tanzania (6 A, 4 P)
1 Cashew nuts (with shell) (P), 2 Maize (A)
Log
10 fraction of yield (year-on-year)
-0.3
Cashew nuts (with shell) (A)
Chick peas (A)
Coconuts (P)
Coffee (green) (P)
Dates (P)
Groundnuts (with shell) (A)
Maize (A)
Mangoes, mangosteens, guavas (P)
Millet (A)
Oranges (P)
Potatoes (A)
Sorghum (A)
0
0.1
0.2
Annual crops (N = 6)
Perennial crops (N = 6)
Deviations log
10 fractions of
yields (year-on-year)
Time series (annual, 1962/1961 -2014/2013)
Selected eastern + southern African countries (N = 10)
A)
B)
Fig. 10.2 Year-on-year yield instability for annual and perennial crops for (a) a subset of analysed
countries from eastern and southern Africa and (b) averaged for each crop across nations and then
across crops, based on FAOSTAT (2017) data. In (a), the y-axis represents a logarithmic transformation of fractional year-on-year yield changes that is an indication of the instability of production. The two crops with the least stable production characteristics for each country, as measured
by the greatest amplitude in consecutive values along the y-axis, are given (see Table 10.1 for this
information for all 10 tested countries). In (b), the same values for instability are used as in (a), but
with the sign of the year-on-year change in yield removed to allow summing across countries and
crops (see Table 10.1 for crops and countries included in (b) calculations)
I. K. Dawson et al.