

646
S. P. Singh and S. Siddhanta
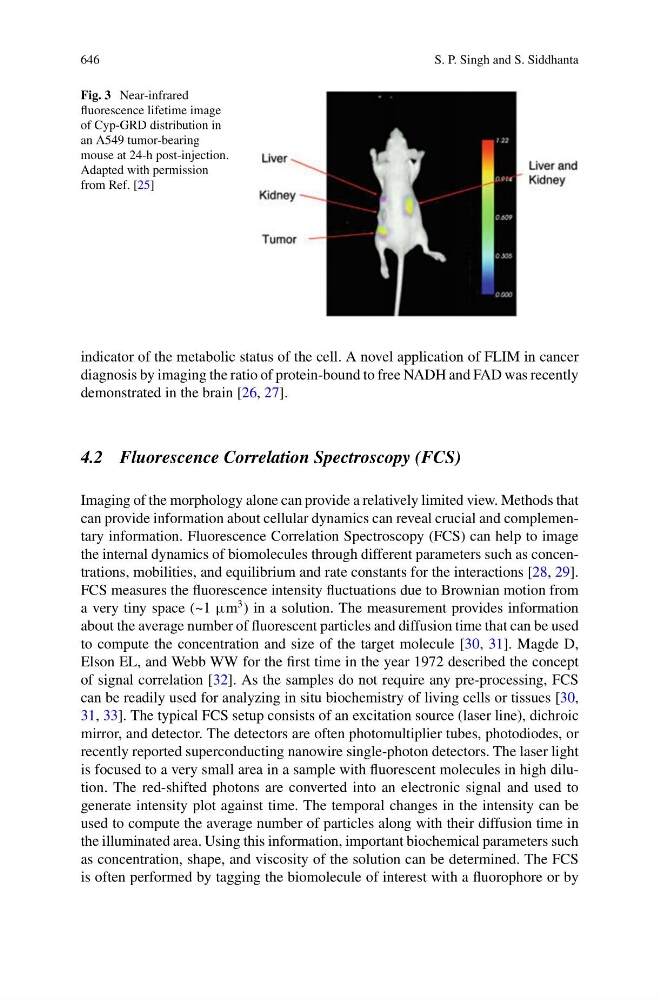
Fig. 3 Near-infrared
fluorescence lifetime image
of Cyp-GRD distribution in
an A549 tumor-bearing
mouse at 24-h post-injection.
Adapted with permission
from Ref. [25]
indicator of the metabolic status of the cell. A novel application of FLIM in cancer
diagnosis by imaging the ratio of protein-bound to free NADH and FAD was recently
demonstrated in the brain [26, 27].
4.2 Fluorescence Correlation Spectroscopy (FCS)
Imaging of the morphology alone can provide a relatively limited view. Methods that
can provide information about cellular dynamics can reveal crucial and complementary information. Fluorescence Correlation Spectroscopy (FCS) can help to image
the internal dynamics of biomolecules through different parameters such as concentrations, mobilities, and equilibrium and rate constants for the interactions [28, 29].
FCS measures the fluorescence intensity fluctuations due to Brownian motion from
a very tiny space (~1 μm
3 ) in a solution. The measurement provides information
about the average number of fluorescent particles and diffusion time that can be used
to compute the concentration and size of the target molecule [30, 31]. Magde D,
Elson EL, and Webb WW for the first time in the year 1972 described the concept
of signal correlation [32]. As the samples do not require any pre-processing, FCS
can be readily used for analyzing in situ biochemistry of living cells or tissues [30,
31, 33]. The typical FCS setup consists of an excitation source (laser line), dichroic
mirror, and detector. The detectors are often photomultiplier tubes, photodiodes, or
recently reported superconducting nanowire single-photon detectors. The laser light
is focused to a very small area in a sample with fluorescent molecules in high dilution. The red-shifted photons are converted into an electronic signal and used to
generate intensity plot against time. The temporal changes in the intensity can be
used to compute the average number of particles along with their diffusion time in
the illuminated area. Using this information, important biochemical parameters such
as concentration, shape, and viscosity of the solution can be determined. The FCS
is often performed by tagging the biomolecule of interest with a fluorophore or by