

Optical Imaging in Biology: Basics and Applications
645
[19]. The lifetime measurements are independent of concentration, absorption, thickness, the intensity of the excitation wavelength, and photo-bleaching effects. Therefore, these are considered more robust than routinely employed intensity-based
imaging. Also, as these measurements are influenced largely by different physiological parameters such as pH, oxygen concentration, and neighboring molecules,
it can be employed for functional imaging as well [19, 20]. The lifetime value is
specific for different kinds of fluorophores and can be obtained experimentally. The
fluorescence intensity decay in a uniform population of molecules excited with a brief
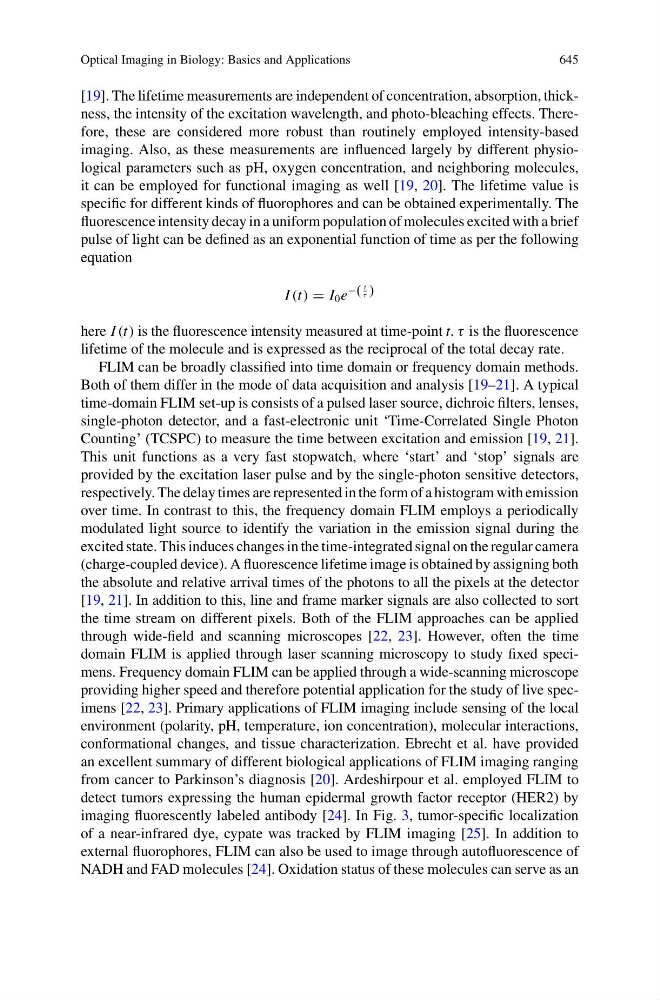
pulse of light can be defined as an exponential function of time as per the following
equation
I (t) = I 0 e
−(
t
τ )
here I (t) is the fluorescence intensity measured at time-point t. τ is the fluorescence
lifetime of the molecule and is expressed as the reciprocal of the total decay rate.
FLIM can be broadly classified into time domain or frequency domain methods.
Both of them differ in the mode of data acquisition and analysis [19–21]. A typical
time-domain FLIM set-up is consists of a pulsed laser source, dichroic filters, lenses,
single-photon detector, and a fast-electronic unit ‘Time-Correlated Single Photon
Counting’ (TCSPC) to measure the time between excitation and emission [19, 21].
This unit functions as a very fast stopwatch, where ‘start’ and ‘stop’ signals are
provided by the excitation laser pulse and by the single-photon sensitive detectors,
respectively. The delay times are represented in the form of a histogram with emission
over time. In contrast to this, the frequency domain FLIM employs a periodically
modulated light source to identify the variation in the emission signal during the
excited state. This induces changes in the time-integrated signal on the regular camera
(charge-coupled device). A fluorescence lifetime image is obtained by assigning both
the absolute and relative arrival times of the photons to all the pixels at the detector
[19, 21]. In addition to this, line and frame marker signals are also collected to sort
the time stream on different pixels. Both of the FLIM approaches can be applied
through wide-field and scanning microscopes [22, 23]. However, often the time
domain FLIM is applied through laser scanning microscopy to study fixed specimens. Frequency domain FLIM can be applied through a wide-scanning microscope
providing higher speed and therefore potential application for the study of live specimens [22, 23]. Primary applications of FLIM imaging include sensing of the local
environment (polarity, pH, temperature, ion concentration), molecular interactions,
conformational changes, and tissue characterization. Ebrecht et al. have provided
an excellent summary of different biological applications of FLIM imaging ranging
from cancer to Parkinson’s diagnosis [20]. Ardeshirpour et al. employed FLIM to
detect tumors expressing the human epidermal growth factor receptor (HER2) by
imaging fluorescently labeled antibody [24]. In Fig. 3, tumor-specific localization
of a near-infrared dye, cypate was tracked by FLIM imaging [25]. In addition to
external fluorophores, FLIM can also be used to image through autofluorescence of
NADH and FAD molecules [24]. Oxidation status of these molecules can serve as an