

616
A. Jariwala et al.
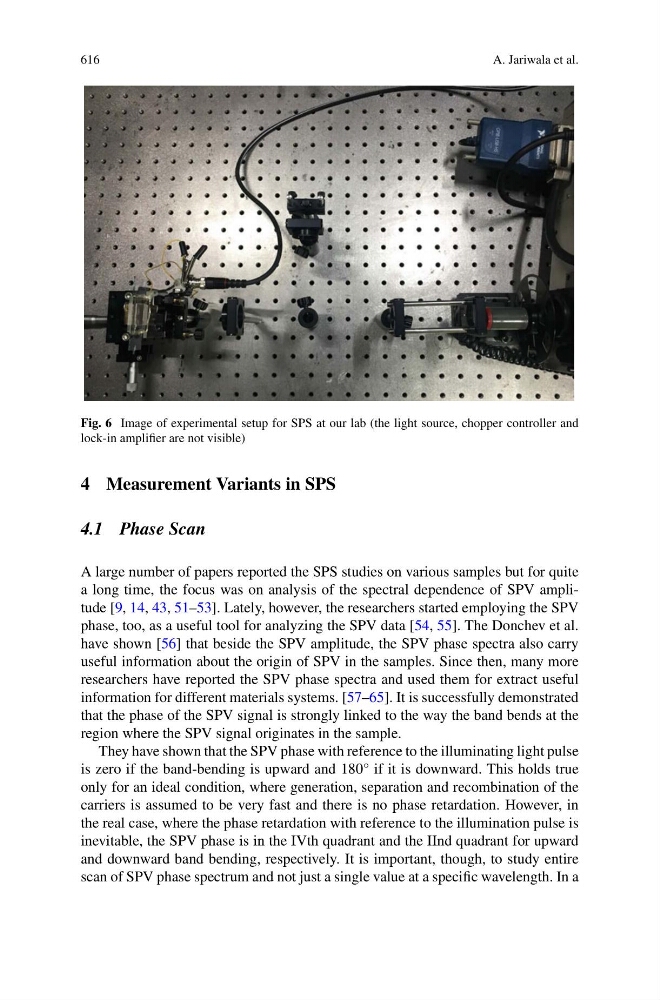
Fig. 6 Image of experimental setup for SPS at our lab (the light source, chopper controller and
lock-in amplifier are not visible)
4 Measurement Variants in SPS
4.1 Phase Scan
A large number of papers reported the SPS studies on various samples but for quite
a long time, the focus was on analysis of the spectral dependence of SPV amplitude [9, 14, 43, 51–53]. Lately, however, the researchers started employing the SPV
phase, too, as a useful tool for analyzing the SPV data [54, 55]. The Donchev et al.
have shown [56] that beside the SPV amplitude, the SPV phase spectra also carry
useful information about the origin of SPV in the samples. Since then, many more
researchers have reported the SPV phase spectra and used them for extract useful
information for different materials systems. [57–65]. It is successfully demonstrated
that the phase of the SPV signal is strongly linked to the way the band bends at the
region where the SPV signal originates in the sample.
They have shown that the SPV phase with reference to the illuminating light pulse
is zero if the band-bending is upward and 180° if it is downward. This holds true
only for an ideal condition, where generation, separation and recombination of the
carriers is assumed to be very fast and there is no phase retardation. However, in
the real case, where the phase retardation with reference to the illumination pulse is
inevitable, the SPV phase is in the IVth quadrant and the IInd quadrant for upward
and downward band bending, respectively. It is important, though, to study entire
scan of SPV phase spectrum and not just a single value at a specific wavelength. In a