

Surface Photo-Voltage Spectroscopy: A Versatile Technique …
617
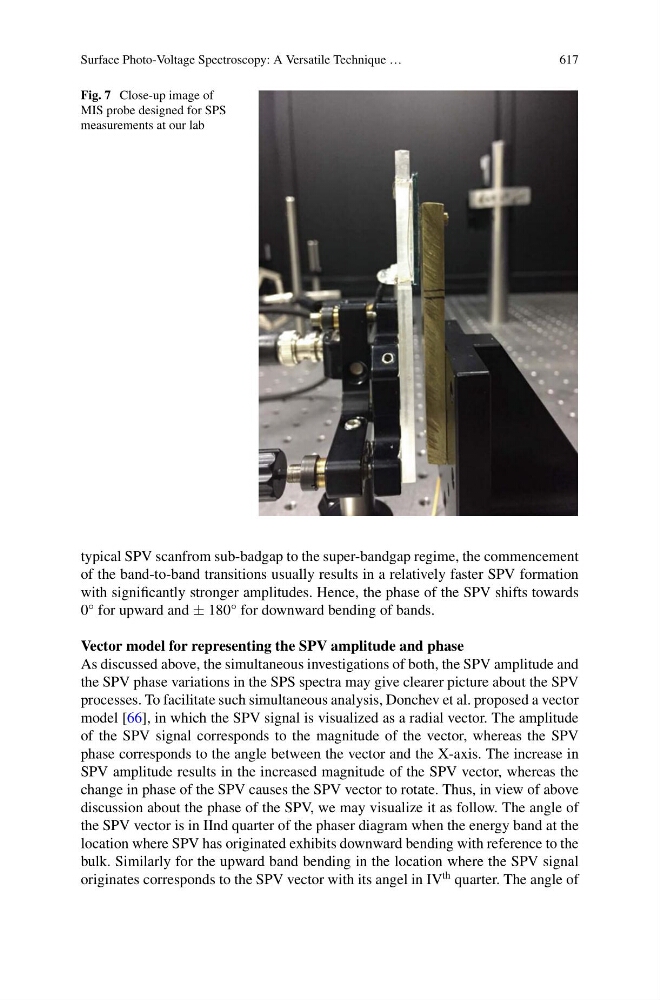
Fig. 7 Close-up image of
MIS probe designed for SPS
measurements at our lab
typical SPV scanfrom sub-badgap to the super-bandgap regime, the commencement
of the band-to-band transitions usually results in a relatively faster SPV formation
with significantly stronger amplitudes. Hence, the phase of the SPV shifts towards
0° for upward and ± 180° for downward bending of bands.
Vector model for representing the SPV amplitude and phase
As discussed above, the simultaneous investigations of both, the SPV amplitude and
the SPV phase variations in the SPS spectra may give clearer picture about the SPV
processes. To facilitate such simultaneous analysis, Donchev et al. proposed a vector
model [66], in which the SPV signal is visualized as a radial vector. The amplitude
of the SPV signal corresponds to the magnitude of the vector, whereas the SPV
phase corresponds to the angle between the vector and the X-axis. The increase in
SPV amplitude results in the increased magnitude of the SPV vector, whereas the
change in phase of the SPV causes the SPV vector to rotate. Thus, in view of above
discussion about the phase of the SPV, we may visualize it as follow. The angle of
the SPV vector is in IInd quarter of the phaser diagram when the energy band at the
location where SPV has originated exhibits downward bending with reference to the
bulk. Similarly for the upward band bending in the location where the SPV signal
originates corresponds to the SPV vector with its angel in IV
th quarter. The angle of