

Surface Photo-Voltage Spectroscopy: A Versatile Technique …
615
such as a dc laser beam, white or UV light etc. is also used to control the charge
dynamics in order to facilitate some additional quantitative analysis [9].
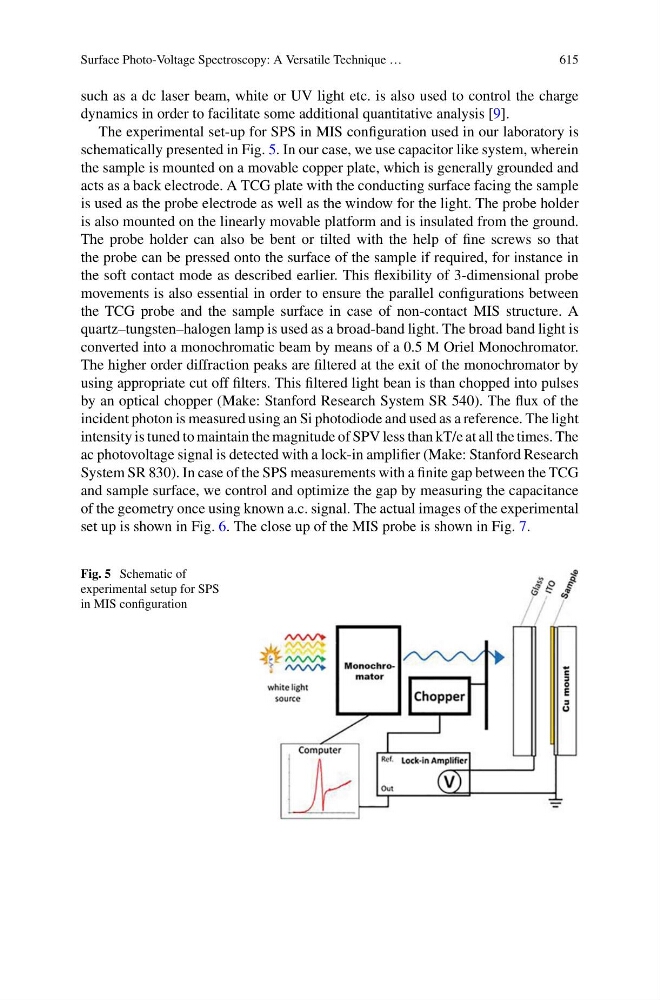
The experimental set-up for SPS in MIS configuration used in our laboratory is
schematically presented in Fig. 5. In our case, we use capacitor like system, wherein
the sample is mounted on a movable copper plate, which is generally grounded and
acts as a back electrode. A TCG plate with the conducting surface facing the sample
is used as the probe electrode as well as the window for the light. The probe holder
is also mounted on the linearly movable platform and is insulated from the ground.
The probe holder can also be bent or tilted with the help of fine screws so that
the probe can be pressed onto the surface of the sample if required, for instance in
the soft contact mode as described earlier. This flexibility of 3-dimensional probe
movements is also essential in order to ensure the parallel configurations between
the TCG probe and the sample surface in case of non-contact MIS structure. A
quartz–tungsten–halogen lamp is used as a broad-band light. The broad band light is
converted into a monochromatic beam by means of a 0.5 M Oriel Monochromator.
The higher order diffraction peaks are filtered at the exit of the monochromator by
using appropriate cut off filters. This filtered light bean is than chopped into pulses
by an optical chopper (Make: Stanford Research System SR 540). The flux of the
incident photon is measured using an Si photodiode and used as a reference. The light
intensity is tuned to maintain the magnitude of SPV less than kT/e at all the times. The
ac photovoltage signal is detected with a lock-in amplifier (Make: Stanford Research
System SR 830). In case of the SPS measurements with a finite gap between the TCG
and sample surface, we control and optimize the gap by measuring the capacitance
of the geometry once using known a.c. signal. The actual images of the experimental
set up is shown in Fig. 6. The close up of the MIS probe is shown in Fig. 7.
Fig. 5 Schematic of
experimental setup for SPS
in MIS configuration