

578
M. Saini et al.
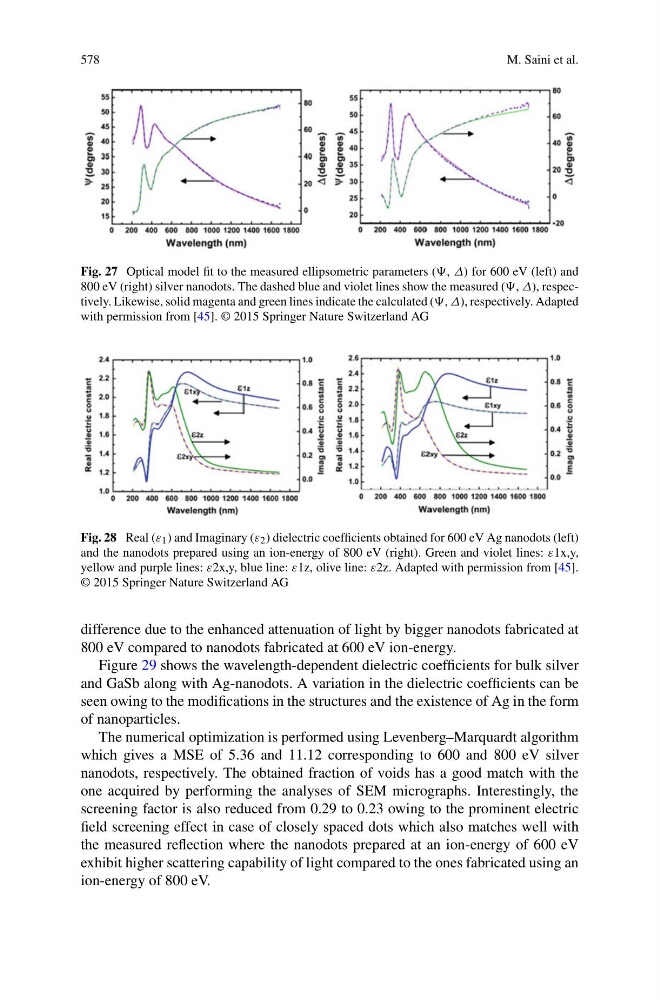
Fig. 27 Optical model fit to the measured ellipsometric parameters (, Δ) for 600 eV (left) and
800 eV (right) silver nanodots. The dashed blue and violet lines show the measured (, Δ), respectively. Likewise, solid magenta and green lines indicate the calculated (, Δ), respectively. Adapted
with permission from [45]. © 2015 Springer Nature Switzerland AG
Fig. 28 Real (ε 1 ) and Imaginary (ε 2 ) dielectric coefficients obtained for 600 eV Ag nanodots (left)
and the nanodots prepared using an ion-energy of 800 eV (right). Green and violet lines: ε1x,y,
yellow and purple lines: ε2x,y, blue line: ε1z, olive line: ε2z. Adapted with permission from [45].
© 2015 Springer Nature Switzerland AG
difference due to the enhanced attenuation of light by bigger nanodots fabricated at
800 eV compared to nanodots fabricated at 600 eV ion-energy.
Figure 29 shows the wavelength-dependent dielectric coefficients for bulk silver
and GaSb along with Ag-nanodots. A variation in the dielectric coefficients can be
seen owing to the modifications in the structures and the existence of Ag in the form
of nanoparticles.
The numerical optimization is performed using Levenberg–Marquardt algorithm
which gives a MSE of 5.36 and 11.12 corresponding to 600 and 800 eV silver
nanodots, respectively. The obtained fraction of voids has a good match with the
one acquired by performing the analyses of SEM micrographs. Interestingly, the
screening factor is also reduced from 0.29 to 0.23 owing to the prominent electric
field screening effect in case of closely spaced dots which also matches well with
the measured reflection where the nanodots prepared at an ion-energy of 600 eV
exhibit higher scattering capability of light compared to the ones fabricated using an
ion-energy of 800 eV.
M. Saini et al.
Fig. 27 Optical model fit to the measured ellipsometric parameters (, Δ) for 600 eV (left) and
800 eV (right) silver nanodots. The dashed blue and violet lines show the measured (, Δ), respectively. Likewise, solid magenta and green lines indicate the calculated (, Δ), respectively. Adapted
with permission from [45]. © 2015 Springer Nature Switzerland AG
Fig. 28 Real (ε 1 ) and Imaginary (ε 2 ) dielectric coefficients obtained for 600 eV Ag nanodots (left)
and the nanodots prepared using an ion-energy of 800 eV (right). Green and violet lines: ε1x,y,
yellow and purple lines: ε2x,y, blue line: ε1z, olive line: ε2z. Adapted with permission from [45].
© 2015 Springer Nature Switzerland AG
difference due to the enhanced attenuation of light by bigger nanodots fabricated at
800 eV compared to nanodots fabricated at 600 eV ion-energy.
Figure 29 shows the wavelength-dependent dielectric coefficients for bulk silver
and GaSb along with Ag-nanodots. A variation in the dielectric coefficients can be
seen owing to the modifications in the structures and the existence of Ag in the form
of nanoparticles.
The numerical optimization is performed using Levenberg–Marquardt algorithm
which gives a MSE of 5.36 and 11.12 corresponding to 600 and 800 eV silver
nanodots, respectively. The obtained fraction of voids has a good match with the
one acquired by performing the analyses of SEM micrographs. Interestingly, the
screening factor is also reduced from 0.29 to 0.23 owing to the prominent electric
field screening effect in case of closely spaced dots which also matches well with
the measured reflection where the nanodots prepared at an ion-energy of 600 eV
exhibit higher scattering capability of light compared to the ones fabricated using an
ion-energy of 800 eV.