

530
N. Yadav and R. Dhar
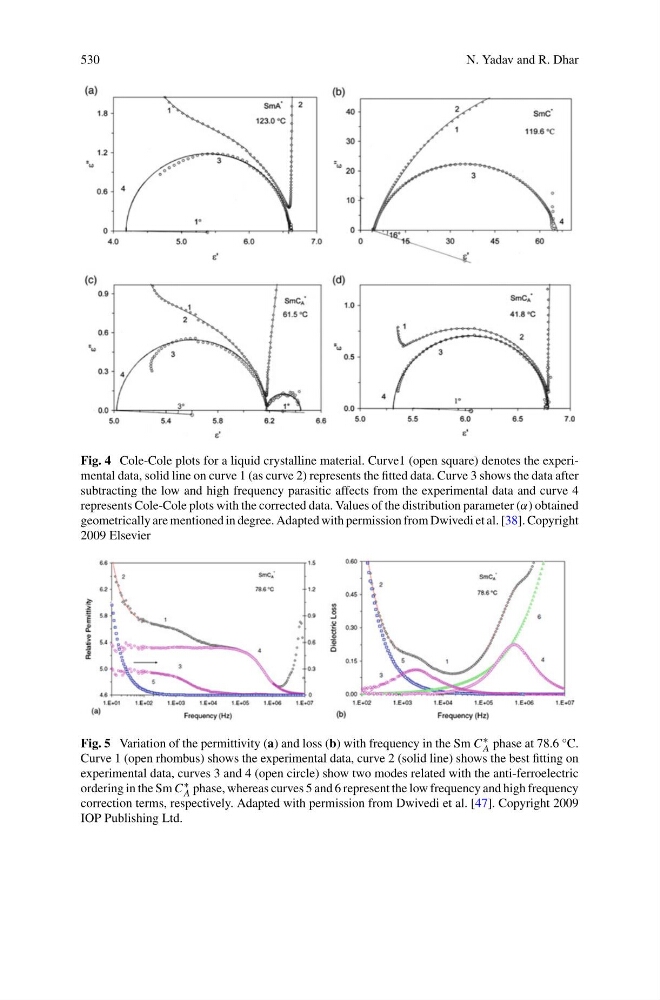
Fig. 4 Cole-Cole plots for a liquid crystalline material. Curve1 (open square) denotes the experimental data, solid line on curve 1 (as curve 2) represents the fitted data. Curve 3 shows the data after
subtracting the low and high frequency parasitic affects from the experimental data and curve 4
represents Cole-Cole plots with the corrected data. Values of the distribution parameter (α) obtained
geometrically are mentioned in degree. Adapted with permission from Dwivedi et al. [38]. Copyright
2009 Elsevier
Fig. 5 Variation of the permittivity (a) and loss (b) with frequency in the Sm C ∗
A phase at 78.6 °C.
Curve 1 (open rhombus) shows the experimental data, curve 2 (solid line) shows the best fitting on
experimental data, curves 3 and 4 (open circle) show two modes related with the anti-ferroelectric
ordering in the Sm C ∗
A phase, whereas curves 5 and 6 represent the low frequency and high frequency
correction terms, respectively. Adapted with permission from Dwivedi et al. [47]. Copyright 2009
IOP Publishing Ltd.
N. Yadav and R. Dhar
Fig. 4 Cole-Cole plots for a liquid crystalline material. Curve1 (open square) denotes the experimental data, solid line on curve 1 (as curve 2) represents the fitted data. Curve 3 shows the data after
subtracting the low and high frequency parasitic affects from the experimental data and curve 4
represents Cole-Cole plots with the corrected data. Values of the distribution parameter (α) obtained
geometrically are mentioned in degree. Adapted with permission from Dwivedi et al. [38]. Copyright
2009 Elsevier
Fig. 5 Variation of the permittivity (a) and loss (b) with frequency in the Sm C ∗
A phase at 78.6 °C.
Curve 1 (open rhombus) shows the experimental data, curve 2 (solid line) shows the best fitting on
experimental data, curves 3 and 4 (open circle) show two modes related with the anti-ferroelectric
ordering in the Sm C ∗
A phase, whereas curves 5 and 6 represent the low frequency and high frequency
correction terms, respectively. Adapted with permission from Dwivedi et al. [47]. Copyright 2009
IOP Publishing Ltd.