

Nuclear Magnetic Resonance Spectroscopy: Theory and Applications
479
Fig. 6 Structure of TMS
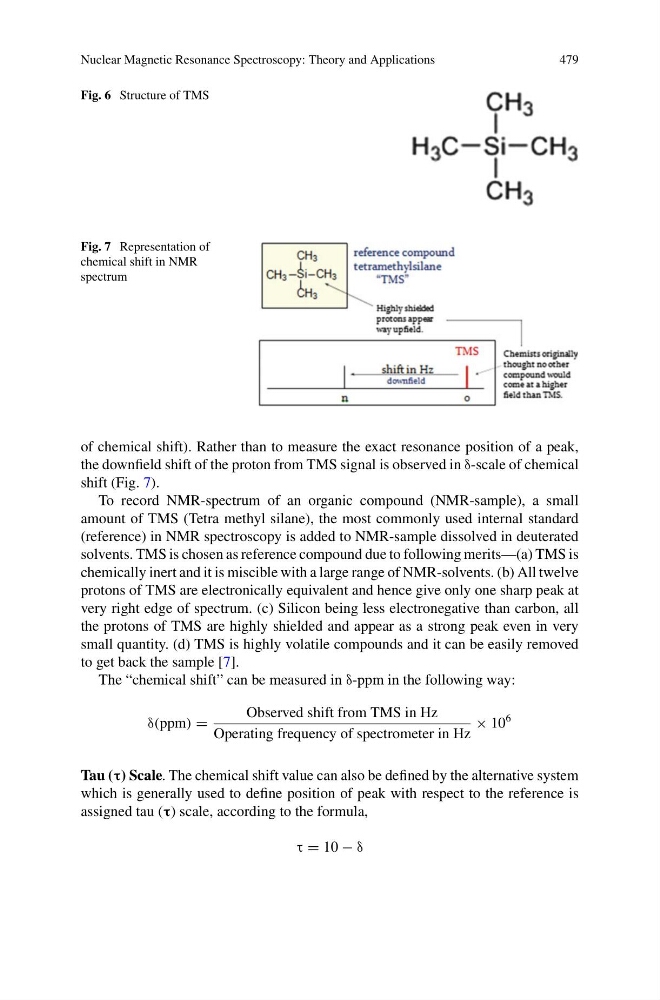
Fig. 7 Representation of
chemical shift in NMR
spectrum
of chemical shift). Rather than to measure the exact resonance position of a peak,
the downfield shift of the proton from TMS signal is observed in δ-scale of chemical
shift (Fig. 7).
To record NMR-spectrum of an organic compound (NMR-sample), a small
amount of TMS (Tetra methyl silane), the most commonly used internal standard
(reference) in NMR spectroscopy is added to NMR-sample dissolved in deuterated
solvents. TMS is chosen as reference compound due to following merits—(a) TMS is
chemically inert and it is miscible with a large range of NMR-solvents. (b) All twelve
protons of TMS are electronically equivalent and hence give only one sharp peak at
very right edge of spectrum. (c) Silicon being less electronegative than carbon, all
the protons of TMS are highly shielded and appear as a strong peak even in very
small quantity. (d) TMS is highly volatile compounds and it can be easily removed
to get back the sample [7].
The “chemical shift” can be measured in δ-ppm in the following way:
δ(ppm) =
Observed shift from TMS in Hz
Operating frequency of spectrometer in Hz
× 10
6
Tau (τ) Scale. The chemical shift value can also be defined by the alternative system
which is generally used to define position of peak with respect to the reference is
assigned tau (τ) scale, according to the formula,
τ = 10 − δ
479
Fig. 6 Structure of TMS
Fig. 7 Representation of
chemical shift in NMR
spectrum
of chemical shift). Rather than to measure the exact resonance position of a peak,
the downfield shift of the proton from TMS signal is observed in δ-scale of chemical
shift (Fig. 7).
To record NMR-spectrum of an organic compound (NMR-sample), a small
amount of TMS (Tetra methyl silane), the most commonly used internal standard
(reference) in NMR spectroscopy is added to NMR-sample dissolved in deuterated
solvents. TMS is chosen as reference compound due to following merits—(a) TMS is
chemically inert and it is miscible with a large range of NMR-solvents. (b) All twelve
protons of TMS are electronically equivalent and hence give only one sharp peak at
very right edge of spectrum. (c) Silicon being less electronegative than carbon, all
the protons of TMS are highly shielded and appear as a strong peak even in very
small quantity. (d) TMS is highly volatile compounds and it can be easily removed
to get back the sample [7].
The “chemical shift” can be measured in δ-ppm in the following way:
δ(ppm) =
Observed shift from TMS in Hz
Operating frequency of spectrometer in Hz
× 10
6
Tau (τ) Scale. The chemical shift value can also be defined by the alternative system
which is generally used to define position of peak with respect to the reference is
assigned tau (τ) scale, according to the formula,
τ = 10 − δ