

454
D. P. Singh et al.
τ =
n
i=1 τ i .A i
n
i=1 A i
=
τ 1 A 1 + τ 2 A 2 + τ 3 A 3 + · · · + τ n A n
A 1 + A 2 + A 3 + · · · + A n
(21)
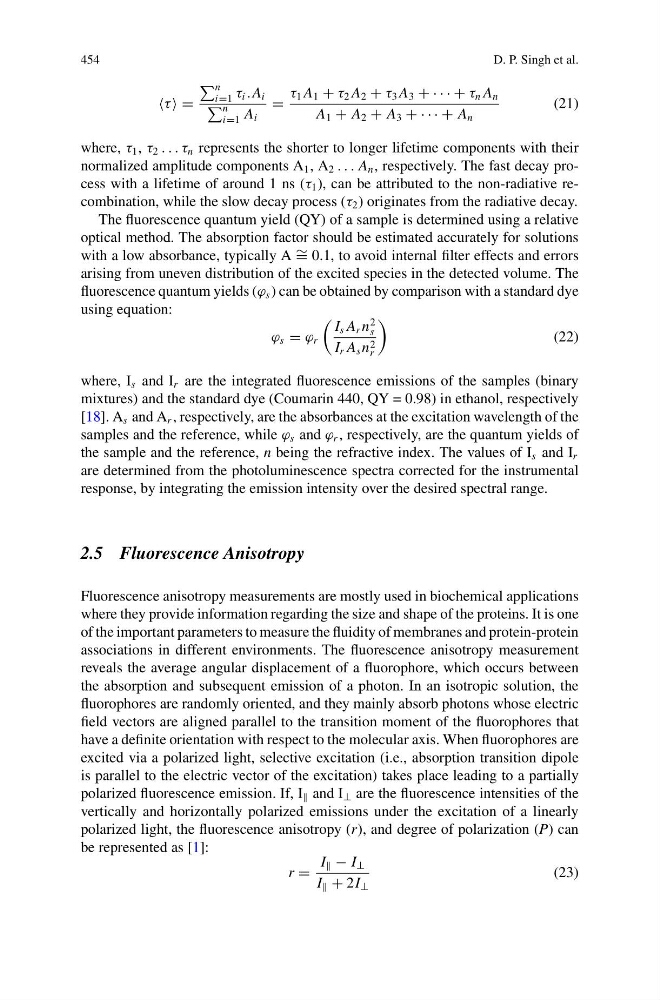
where, τ 1 , τ 2 . . . τ n represents the shorter to longer lifetime components with their
normalized amplitude components A 1 , A 2 . . . A n , respectively. The fast decay process with a lifetime of around 1 ns (τ 1 ), can be attributed to the non-radiative recombination, while the slow decay process (τ 2 ) originates from the radiative decay.
The fluorescence quantum yield (QY) of a sample is determined using a relative
optical method. The absorption factor should be estimated accurately for solutions
with a low absorbance, typically A ∼ = 0.1, to avoid internal filter effects and errors
arising from uneven distribution of the excited species in the detected volume. The
fluorescence quantum yields (ϕ s ) can be obtained by comparison with a standard dye
using equation:
ϕ s = ϕ r
I s A r n
2
s
I r A s n 2
r
(22)
where, I s and I r are the integrated fluorescence emissions of the samples (binary
mixtures) and the standard dye (Coumarin 440, QY = 0.98) in ethanol, respectively
[18]. A s and A r , respectively, are the absorbances at the excitation wavelength of the
samples and the reference, while ϕ s and ϕ r , respectively, are the quantum yields of
the sample and the reference, n being the refractive index. The values of I s and I r
are determined from the photoluminescence spectra corrected for the instrumental
response, by integrating the emission intensity over the desired spectral range.
2.5 Fluorescence Anisotropy
Fluorescence anisotropy measurements are mostly used in biochemical applications
where they provide information regarding the size and shape of the proteins. It is one
of the important parameters to measure the fluidity of membranes and protein-protein
associations in different environments. The fluorescence anisotropy measurement
reveals the average angular displacement of a fluorophore, which occurs between
the absorption and subsequent emission of a photon. In an isotropic solution, the
fluorophores are randomly oriented, and they mainly absorb photons whose electric
field vectors are aligned parallel to the transition moment of the fluorophores that
have a definite orientation with respect to the molecular axis. When fluorophores are
excited via a polarized light, selective excitation (i.e., absorption transition dipole
is parallel to the electric vector of the excitation) takes place leading to a partially
polarized fluorescence emission. If, I and I ⊥ are the fluorescence intensities of the
vertically and horizontally polarized emissions under the excitation of a linearly
polarized light, the fluorescence anisotropy (r), and degree of polarization (P) can
be represented as [1]:
r =
I − I ⊥
I + 2I ⊥
(23)
D. P. Singh et al.
τ =
n
i=1 τ i .A i
n
i=1 A i
=
τ 1 A 1 + τ 2 A 2 + τ 3 A 3 + · · · + τ n A n
A 1 + A 2 + A 3 + · · · + A n
(21)
where, τ 1 , τ 2 . . . τ n represents the shorter to longer lifetime components with their
normalized amplitude components A 1 , A 2 . . . A n , respectively. The fast decay process with a lifetime of around 1 ns (τ 1 ), can be attributed to the non-radiative recombination, while the slow decay process (τ 2 ) originates from the radiative decay.
The fluorescence quantum yield (QY) of a sample is determined using a relative
optical method. The absorption factor should be estimated accurately for solutions
with a low absorbance, typically A ∼ = 0.1, to avoid internal filter effects and errors
arising from uneven distribution of the excited species in the detected volume. The
fluorescence quantum yields (ϕ s ) can be obtained by comparison with a standard dye
using equation:
ϕ s = ϕ r
I s A r n
2
s
I r A s n 2
r
(22)
where, I s and I r are the integrated fluorescence emissions of the samples (binary
mixtures) and the standard dye (Coumarin 440, QY = 0.98) in ethanol, respectively
[18]. A s and A r , respectively, are the absorbances at the excitation wavelength of the
samples and the reference, while ϕ s and ϕ r , respectively, are the quantum yields of
the sample and the reference, n being the refractive index. The values of I s and I r
are determined from the photoluminescence spectra corrected for the instrumental
response, by integrating the emission intensity over the desired spectral range.
2.5 Fluorescence Anisotropy
Fluorescence anisotropy measurements are mostly used in biochemical applications
where they provide information regarding the size and shape of the proteins. It is one
of the important parameters to measure the fluidity of membranes and protein-protein
associations in different environments. The fluorescence anisotropy measurement
reveals the average angular displacement of a fluorophore, which occurs between
the absorption and subsequent emission of a photon. In an isotropic solution, the
fluorophores are randomly oriented, and they mainly absorb photons whose electric
field vectors are aligned parallel to the transition moment of the fluorophores that
have a definite orientation with respect to the molecular axis. When fluorophores are
excited via a polarized light, selective excitation (i.e., absorption transition dipole
is parallel to the electric vector of the excitation) takes place leading to a partially
polarized fluorescence emission. If, I and I ⊥ are the fluorescence intensities of the
vertically and horizontally polarized emissions under the excitation of a linearly
polarized light, the fluorescence anisotropy (r), and degree of polarization (P) can
be represented as [1]:
r =
I − I ⊥
I + 2I ⊥
(23)