

Fluorescence Spectrometry
439
Mirror image Rule: This rule describes that the absorption spectrum of many fluorophores is a mirror image of the emission spectrum. This is analogous to the
Franck-Condon principle which reveals that the vibrational levels of the excited state
resemble the vibration levels of the ground state without movement of the nucleus.
This means that the nuclear configuration of the molecule experiences no significant
change when a molecule undergoes an electronic transition. For example, S o →
S 1 and S 1 → S o transitions are identical to each other. If a fluorophore undergoes
S o → S n transition; its relaxation passage will take place from S n → S 1 followed by
a successive transition from S 1 → S o .
Inner Filter Effect: According to Eq. (1), the fluorescence intensity is linearly proportional to the optical density (OD) (i.e., cl). In a normal fluorescence spectrometer,
the detector records the emission beam perpendicular to the excitation beam. It is
essential for the incident excitation beam to travel up to the half of the cuvette path
length. The induced emission beam at the center of the cuvette should also follow
this traveling rule before being detected. Therefore, the recorded emission intensity
includes the optical densities at both the excitation and emission wavelengths. The
absorption by the solution is known as the inner filter effect that not only shifts the
emission peak but also reduces the fluorescence intensity. It can be corrected by
using: F corrected = F recorded × 10
O D
, where OD
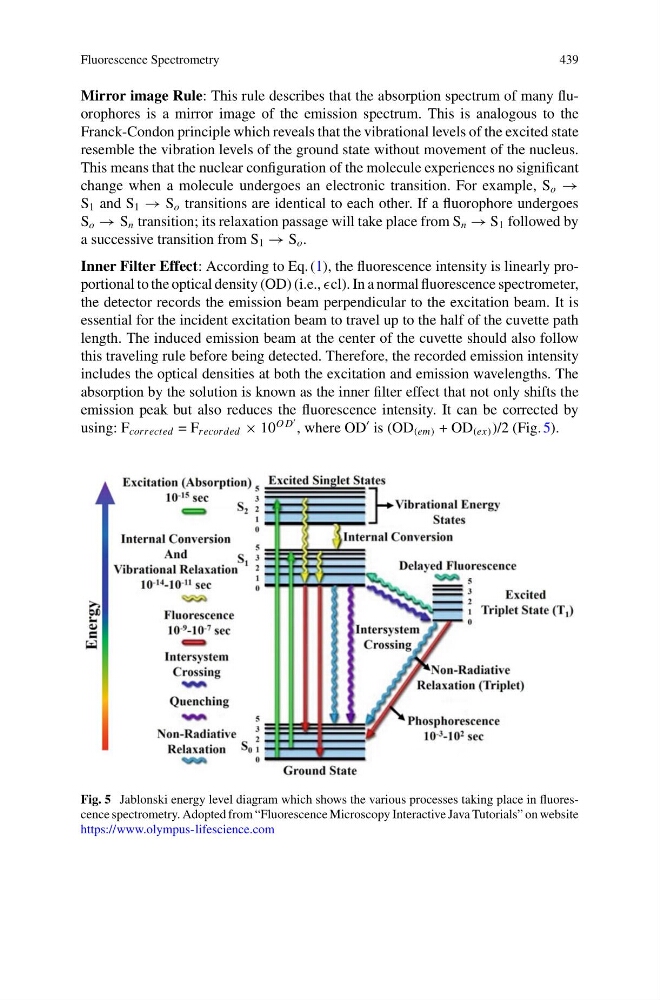
is (OD (em) + OD (ex) )/2 (Fig. 5).
Fig. 5 Jablonski energy level diagram which shows the various processes taking place in fluorescence spectrometry. Adopted from “Fluorescence Microscopy Interactive Java Tutorials” on website
https://www.olympus-lifescience.com
439
Mirror image Rule: This rule describes that the absorption spectrum of many fluorophores is a mirror image of the emission spectrum. This is analogous to the
Franck-Condon principle which reveals that the vibrational levels of the excited state
resemble the vibration levels of the ground state without movement of the nucleus.
This means that the nuclear configuration of the molecule experiences no significant
change when a molecule undergoes an electronic transition. For example, S o →
S 1 and S 1 → S o transitions are identical to each other. If a fluorophore undergoes
S o → S n transition; its relaxation passage will take place from S n → S 1 followed by
a successive transition from S 1 → S o .
Inner Filter Effect: According to Eq. (1), the fluorescence intensity is linearly proportional to the optical density (OD) (i.e., cl). In a normal fluorescence spectrometer,
the detector records the emission beam perpendicular to the excitation beam. It is
essential for the incident excitation beam to travel up to the half of the cuvette path
length. The induced emission beam at the center of the cuvette should also follow
this traveling rule before being detected. Therefore, the recorded emission intensity
includes the optical densities at both the excitation and emission wavelengths. The
absorption by the solution is known as the inner filter effect that not only shifts the
emission peak but also reduces the fluorescence intensity. It can be corrected by
using: F corrected = F recorded × 10
O D
, where OD
is (OD (em) + OD (ex) )/2 (Fig. 5).
Fig. 5 Jablonski energy level diagram which shows the various processes taking place in fluorescence spectrometry. Adopted from “Fluorescence Microscopy Interactive Java Tutorials” on website
https://www.olympus-lifescience.com