

Wavelength Modulation Spectroscopy
357
the lasers is predominantly linear, and especially when etalon noise is dominant.
Estimates of I 1 would be more accurate than estimates of I 2 that is required in
Eq. 34 but not in Eq. 33. The digital filtering technique to extract the system parameter
I //I 1 usable even when no baseline is available due to spectral congestion, pressure
broadening, limited laser tunability and etalon noise.
7 Detection Sensitivity
The main sources of noise in the detection system are thermal noise due to the
random thermal excitation of electron-hole pairs across the energy bandgap of the
photodiode and optical etalon fringes due to multiple reflections from the various
optical surfaces. The thermal noise is especially problematic for low-bandgap semiconductors such as the mercury-cadmium telluride (MCT) detectors that are used
for mid-IR wavelengths. The detection sensitivity of a TDLS sensor can be significantly improved by thermo-electric cooling of the detector and signal averaging.
While detector cooling is always beneficial, long averaging times do not necessarily
improve sensitivity. Averaging improves the SNR so long as the data samples are
uncorrelated (i.e. the signal is predominantly affected by white noise). In 1966, David
W. Allan proposed a statistical method (now known as the Allan variance) to measure
the frequency stability of atomic clocks. Later, Peter Werle introduced Allan variance
as a tool to characterize the optimum integration time and detection limit of TDLS
systems [63]. Since then, Allan variance has become the standard method to determine the detection limit of laser spectroscopic sensors in the presence of 1/f noise
and etalon fringes. Calculation of the Allan variance requires a calibrated gas sample
to be held between the laser and photo-detector so that the variations in signal level
are only due to noise and not due to changes in mole fraction. The photo-detector
signal is monitored over a duration to acquire m measurements (typically m ≥ 500)
of the same gas sample. The Allan deviation (square root of the Allan variance) of
this data is then plotted on a log-log scale as a function of the integration time. Let
x i (where i = 1, 2, . . . , m) be a set of recorded data from m measurements of mole
fraction and they are divided into s subgroups with k elements in each subgroup. The
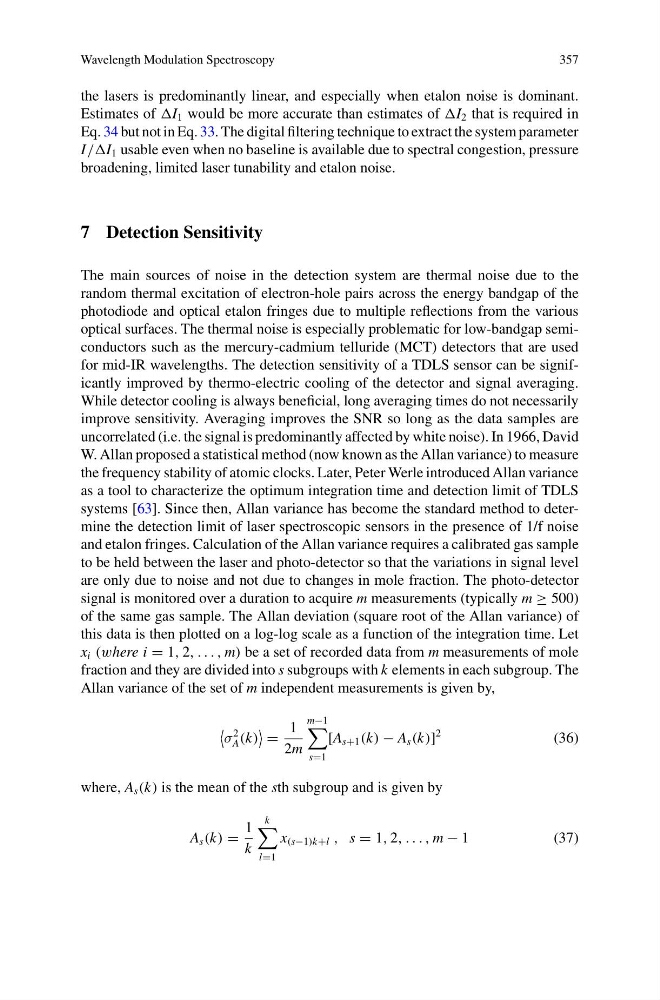
Allan variance of the set of m independent measurements is given by,
σ
2
A (k)
=
1
2m
m−1
s=1
[A s+1 (k) − A s (k)]
2
(36)
where, A s (k) is the mean of the sth subgroup and is given by
A s (k) =
1
k
k
l=1
x (s−1)k+l , s = 1, 2, . . . , m − 1
(37)
357
the lasers is predominantly linear, and especially when etalon noise is dominant.
Estimates of I 1 would be more accurate than estimates of I 2 that is required in
Eq. 34 but not in Eq. 33. The digital filtering technique to extract the system parameter
I //I 1 usable even when no baseline is available due to spectral congestion, pressure
broadening, limited laser tunability and etalon noise.
7 Detection Sensitivity
The main sources of noise in the detection system are thermal noise due to the
random thermal excitation of electron-hole pairs across the energy bandgap of the
photodiode and optical etalon fringes due to multiple reflections from the various
optical surfaces. The thermal noise is especially problematic for low-bandgap semiconductors such as the mercury-cadmium telluride (MCT) detectors that are used
for mid-IR wavelengths. The detection sensitivity of a TDLS sensor can be significantly improved by thermo-electric cooling of the detector and signal averaging.
While detector cooling is always beneficial, long averaging times do not necessarily
improve sensitivity. Averaging improves the SNR so long as the data samples are
uncorrelated (i.e. the signal is predominantly affected by white noise). In 1966, David
W. Allan proposed a statistical method (now known as the Allan variance) to measure
the frequency stability of atomic clocks. Later, Peter Werle introduced Allan variance
as a tool to characterize the optimum integration time and detection limit of TDLS
systems [63]. Since then, Allan variance has become the standard method to determine the detection limit of laser spectroscopic sensors in the presence of 1/f noise
and etalon fringes. Calculation of the Allan variance requires a calibrated gas sample
to be held between the laser and photo-detector so that the variations in signal level
are only due to noise and not due to changes in mole fraction. The photo-detector
signal is monitored over a duration to acquire m measurements (typically m ≥ 500)
of the same gas sample. The Allan deviation (square root of the Allan variance) of
this data is then plotted on a log-log scale as a function of the integration time. Let
x i (where i = 1, 2, . . . , m) be a set of recorded data from m measurements of mole
fraction and they are divided into s subgroups with k elements in each subgroup. The
Allan variance of the set of m independent measurements is given by,
σ
2
A (k)
=
1
2m
m−1
s=1
[A s+1 (k) − A s (k)]
2
(36)
where, A s (k) is the mean of the sth subgroup and is given by
A s (k) =
1
k
k
l=1
x (s−1)k+l , s = 1, 2, . . . , m − 1
(37)