

358
A. L. Chakraborty and A. Roy
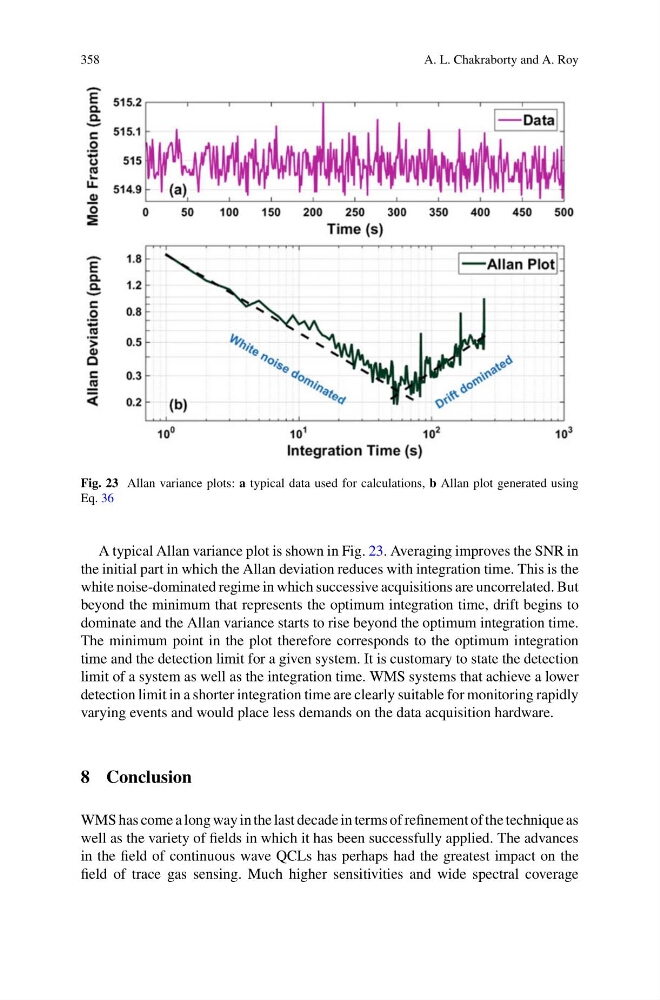
Fig. 23 Allan variance plots: a typical data used for calculations, b Allan plot generated using
Eq. 36
A typical Allan variance plot is shown in Fig. 23. Averaging improves the SNR in
the initial part in which the Allan deviation reduces with integration time. This is the
white noise-dominated regime in which successive acquisitions are uncorrelated. But
beyond the minimum that represents the optimum integration time, drift begins to
dominate and the Allan variance starts to rise beyond the optimum integration time.
The minimum point in the plot therefore corresponds to the optimum integration
time and the detection limit for a given system. It is customary to state the detection
limit of a system as well as the integration time. WMS systems that achieve a lower
detection limit in a shorter integration time are clearly suitable for monitoring rapidly
varying events and would place less demands on the data acquisition hardware.
8 Conclusion
WMS has come a long way in the last decade in terms of refinement of the technique as
well as the variety of fields in which it has been successfully applied. The advances
in the field of continuous wave QCLs has perhaps had the greatest impact on the
field of trace gas sensing. Much higher sensitivities and wide spectral coverage
A. L. Chakraborty and A. Roy
Fig. 23 Allan variance plots: a typical data used for calculations, b Allan plot generated using
Eq. 36
A typical Allan variance plot is shown in Fig. 23. Averaging improves the SNR in
the initial part in which the Allan deviation reduces with integration time. This is the
white noise-dominated regime in which successive acquisitions are uncorrelated. But
beyond the minimum that represents the optimum integration time, drift begins to
dominate and the Allan variance starts to rise beyond the optimum integration time.
The minimum point in the plot therefore corresponds to the optimum integration
time and the detection limit for a given system. It is customary to state the detection
limit of a system as well as the integration time. WMS systems that achieve a lower
detection limit in a shorter integration time are clearly suitable for monitoring rapidly
varying events and would place less demands on the data acquisition hardware.
8 Conclusion
WMS has come a long way in the last decade in terms of refinement of the technique as
well as the variety of fields in which it has been successfully applied. The advances
in the field of continuous wave QCLs has perhaps had the greatest impact on the
field of trace gas sensing. Much higher sensitivities and wide spectral coverage