

350
A. L. Chakraborty and A. Roy
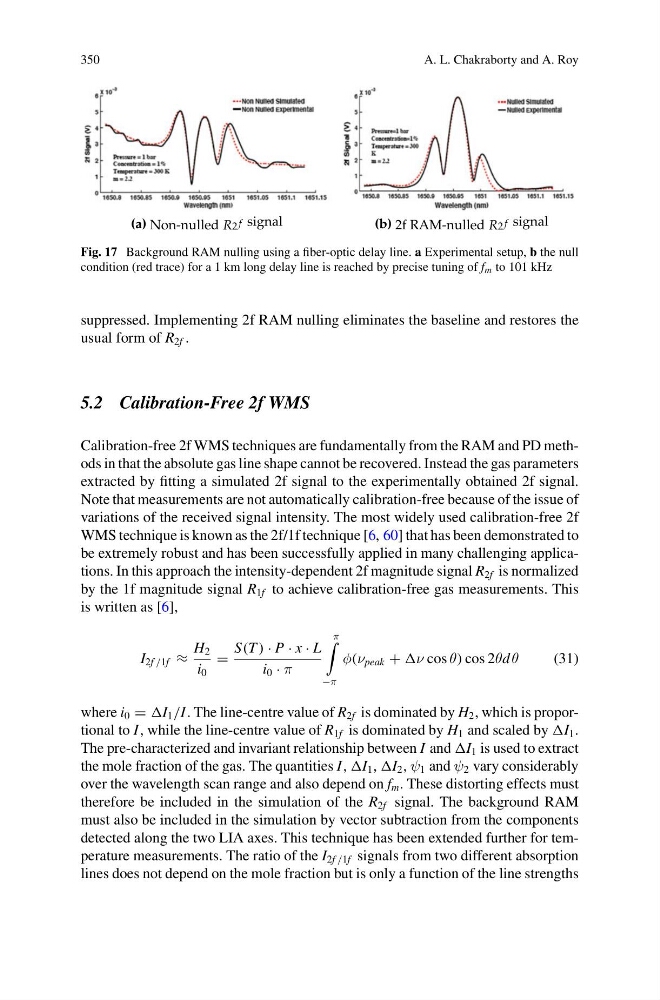
Fig. 17 Background RAM nulling using a fiber-optic delay line. a Experimental setup, b the null
condition (red trace) for a 1 km long delay line is reached by precise tuning of f m to 101 kHz
suppressed. Implementing 2f RAM nulling eliminates the baseline and restores the
usual form of R 2f .
5.2 Calibration-Free 2f WMS
Calibration-free 2f WMS techniques are fundamentally from the RAM and PD methods in that the absolute gas line shape cannot be recovered. Instead the gas parameters
extracted by fitting a simulated 2f signal to the experimentally obtained 2f signal.
Note that measurements are not automatically calibration-free because of the issue of
variations of the received signal intensity. The most widely used calibration-free 2f
WMS technique is known as the 2f/1f technique [6, 60] that has been demonstrated to
be extremely robust and has been successfully applied in many challenging applications. In this approach the intensity-dependent 2f magnitude signal R 2f is normalized
by the 1f magnitude signal R 1f to achieve calibration-free gas measurements. This
is written as [6],
I 2f /1f ≈
H 2
i 0
=
S(T ) · P · x · L
i 0 · π
π
−π
φ(ν peak + cos θ) cos 2θd θ
(31)
where i 0 = 1 /I . The line-centre value of R 2f is dominated by H 2 , which is proportional to I , while the line-centre value of R 1f is dominated by H 1 and scaled by 1 .
The pre-characterized and invariant relationship between I and 1 is used to extract
the mole fraction of the gas. The quantities I , 1 , 2 , ψ 1 and ψ 2 vary considerably
over the wavelength scan range and also depend on f m . These distorting effects must
therefore be included in the simulation of the R 2f signal. The background RAM
must also be included in the simulation by vector subtraction from the components
detected along the two LIA axes. This technique has been extended further for temperature measurements. The ratio of the I 2f /1f signals from two different absorption
lines does not depend on the mole fraction but is only a function of the line strengths
A. L. Chakraborty and A. Roy
Fig. 17 Background RAM nulling using a fiber-optic delay line. a Experimental setup, b the null
condition (red trace) for a 1 km long delay line is reached by precise tuning of f m to 101 kHz
suppressed. Implementing 2f RAM nulling eliminates the baseline and restores the
usual form of R 2f .
5.2 Calibration-Free 2f WMS
Calibration-free 2f WMS techniques are fundamentally from the RAM and PD methods in that the absolute gas line shape cannot be recovered. Instead the gas parameters
extracted by fitting a simulated 2f signal to the experimentally obtained 2f signal.
Note that measurements are not automatically calibration-free because of the issue of
variations of the received signal intensity. The most widely used calibration-free 2f
WMS technique is known as the 2f/1f technique [6, 60] that has been demonstrated to
be extremely robust and has been successfully applied in many challenging applications. In this approach the intensity-dependent 2f magnitude signal R 2f is normalized
by the 1f magnitude signal R 1f to achieve calibration-free gas measurements. This
is written as [6],
I 2f /1f ≈
H 2
i 0
=
S(T ) · P · x · L
i 0 · π
π
−π
φ(ν peak + cos θ) cos 2θd θ
(31)
where i 0 = 1 /I . The line-centre value of R 2f is dominated by H 2 , which is proportional to I , while the line-centre value of R 1f is dominated by H 1 and scaled by 1 .
The pre-characterized and invariant relationship between I and 1 is used to extract
the mole fraction of the gas. The quantities I , 1 , 2 , ψ 1 and ψ 2 vary considerably
over the wavelength scan range and also depend on f m . These distorting effects must
therefore be included in the simulation of the R 2f signal. The background RAM
must also be included in the simulation by vector subtraction from the components
detected along the two LIA axes. This technique has been extended further for temperature measurements. The ratio of the I 2f /1f signals from two different absorption
lines does not depend on the mole fraction but is only a function of the line strengths