

Wavelength Modulation Spectroscopy
351
at the two line centre values, which are functions of the temperature.
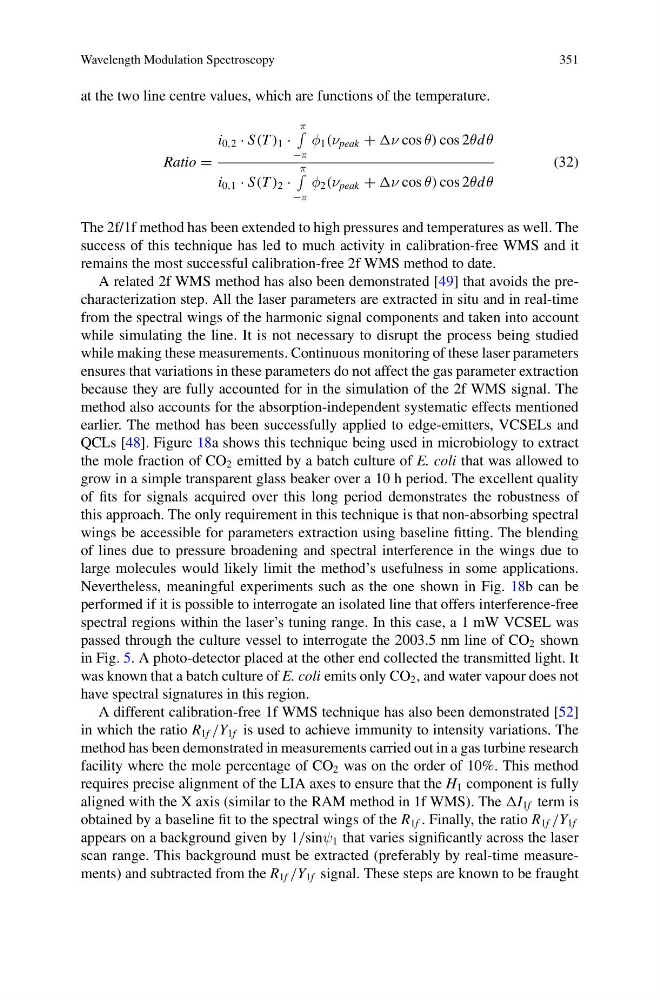
Ratio =
i 0,2 · S(T ) 1 ·
π
−π
φ 1 (ν peak + ν cos θ) cos 2θd θ
i 0,1 · S(T ) 2 ·
π
−π
φ 2 (ν peak + ν cos θ) cos 2θd θ
(32)
The 2f/1f method has been extended to high pressures and temperatures as well. The
success of this technique has led to much activity in calibration-free WMS and it
remains the most successful calibration-free 2f WMS method to date.
A related 2f WMS method has also been demonstrated [49] that avoids the precharacterization step. All the laser parameters are extracted in situ and in real-time
from the spectral wings of the harmonic signal components and taken into account
while simulating the line. It is not necessary to disrupt the process being studied
while making these measurements. Continuous monitoring of these laser parameters
ensures that variations in these parameters do not affect the gas parameter extraction
because they are fully accounted for in the simulation of the 2f WMS signal. The
method also accounts for the absorption-independent systematic effects mentioned
earlier. The method has been successfully applied to edge-emitters, VCSELs and
QCLs [48]. Figure 18a shows this technique being used in microbiology to extract
the mole fraction of CO 2 emitted by a batch culture of E. coli that was allowed to
grow in a simple transparent glass beaker over a 10 h period. The excellent quality
of fits for signals acquired over this long period demonstrates the robustness of
this approach. The only requirement in this technique is that non-absorbing spectral
wings be accessible for parameters extraction using baseline fitting. The blending
of lines due to pressure broadening and spectral interference in the wings due to
large molecules would likely limit the method’s usefulness in some applications.
Nevertheless, meaningful experiments such as the one shown in Fig. 18b can be
performed if it is possible to interrogate an isolated line that offers interference-free
spectral regions within the laser’s tuning range. In this case, a 1 mW VCSEL was
passed through the culture vessel to interrogate the 2003.5 nm line of CO 2 shown
in Fig. 5. A photo-detector placed at the other end collected the transmitted light. It
was known that a batch culture of E. coli emits only CO 2 , and water vapour does not
have spectral signatures in this region.
A different calibration-free 1f WMS technique has also been demonstrated [52]
in which the ratio R 1f /Y 1f is used to achieve immunity to intensity variations. The
method has been demonstrated in measurements carried out in a gas turbine research
facility where the mole percentage of CO 2 was on the order of 10%. This method
requires precise alignment of the LIA axes to ensure that the H 1 component is fully
aligned with the X axis (similar to the RAM method in 1f WMS). The I 1f term is
obtained by a baseline fit to the spectral wings of the R 1f . Finally, the ratio R 1f /Y 1f
appears on a background given by 1/sinψ 1 that varies significantly across the laser
scan range. This background must be extracted (preferably by real-time measurements) and subtracted from the R 1f /Y 1f signal. These steps are known to be fraught
351
at the two line centre values, which are functions of the temperature.
Ratio =
i 0,2 · S(T ) 1 ·
π
−π
φ 1 (ν peak + ν cos θ) cos 2θd θ
i 0,1 · S(T ) 2 ·
π
−π
φ 2 (ν peak + ν cos θ) cos 2θd θ
(32)
The 2f/1f method has been extended to high pressures and temperatures as well. The
success of this technique has led to much activity in calibration-free WMS and it
remains the most successful calibration-free 2f WMS method to date.
A related 2f WMS method has also been demonstrated [49] that avoids the precharacterization step. All the laser parameters are extracted in situ and in real-time
from the spectral wings of the harmonic signal components and taken into account
while simulating the line. It is not necessary to disrupt the process being studied
while making these measurements. Continuous monitoring of these laser parameters
ensures that variations in these parameters do not affect the gas parameter extraction
because they are fully accounted for in the simulation of the 2f WMS signal. The
method also accounts for the absorption-independent systematic effects mentioned
earlier. The method has been successfully applied to edge-emitters, VCSELs and
QCLs [48]. Figure 18a shows this technique being used in microbiology to extract
the mole fraction of CO 2 emitted by a batch culture of E. coli that was allowed to
grow in a simple transparent glass beaker over a 10 h period. The excellent quality
of fits for signals acquired over this long period demonstrates the robustness of
this approach. The only requirement in this technique is that non-absorbing spectral
wings be accessible for parameters extraction using baseline fitting. The blending
of lines due to pressure broadening and spectral interference in the wings due to
large molecules would likely limit the method’s usefulness in some applications.
Nevertheless, meaningful experiments such as the one shown in Fig. 18b can be
performed if it is possible to interrogate an isolated line that offers interference-free
spectral regions within the laser’s tuning range. In this case, a 1 mW VCSEL was
passed through the culture vessel to interrogate the 2003.5 nm line of CO 2 shown
in Fig. 5. A photo-detector placed at the other end collected the transmitted light. It
was known that a batch culture of E. coli emits only CO 2 , and water vapour does not
have spectral signatures in this region.
A different calibration-free 1f WMS technique has also been demonstrated [52]
in which the ratio R 1f /Y 1f is used to achieve immunity to intensity variations. The
method has been demonstrated in measurements carried out in a gas turbine research
facility where the mole percentage of CO 2 was on the order of 10%. This method
requires precise alignment of the LIA axes to ensure that the H 1 component is fully
aligned with the X axis (similar to the RAM method in 1f WMS). The I 1f term is
obtained by a baseline fit to the spectral wings of the R 1f . Finally, the ratio R 1f /Y 1f
appears on a background given by 1/sinψ 1 that varies significantly across the laser
scan range. This background must be extracted (preferably by real-time measurements) and subtracted from the R 1f /Y 1f signal. These steps are known to be fraught