

Wavelength Modulation Spectroscopy
343
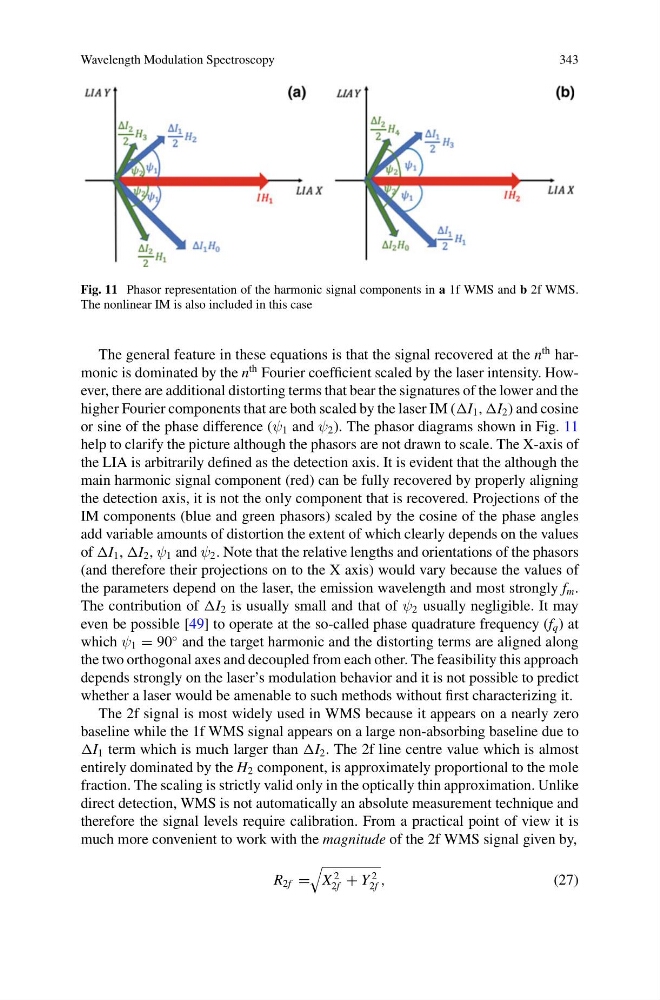
Fig. 11 Phasor representation of the harmonic signal components in a 1f WMS and b 2f WMS.
The nonlinear IM is also included in this case
The general feature in these equations is that the signal recovered at the n
th harmonic is dominated by the n
th Fourier coefficient scaled by the laser intensity. However, there are additional distorting terms that bear the signatures of the lower and the
higher Fourier components that are both scaled by the laser IM (I 1 , I 2 ) and cosine
or sine of the phase difference (ψ 1 and ψ 2 ). The phasor diagrams shown in Fig. 11
help to clarify the picture although the phasors are not drawn to scale. The X-axis of
the LIA is arbitrarily defined as the detection axis. It is evident that the although the
main harmonic signal component (red) can be fully recovered by properly aligning
the detection axis, it is not the only component that is recovered. Projections of the
IM components (blue and green phasors) scaled by the cosine of the phase angles
add variable amounts of distortion the extent of which clearly depends on the values
of I 1 , I 2 , ψ 1 and ψ 2 . Note that the relative lengths and orientations of the phasors
(and therefore their projections on to the X axis) would vary because the values of
the parameters depend on the laser, the emission wavelength and most strongly f m .
The contribution of I 2 is usually small and that of ψ 2 usually negligible. It may
even be possible [49] to operate at the so-called phase quadrature frequency (f q ) at
which ψ 1 = 90
◦ and the target harmonic and the distorting terms are aligned along
the two orthogonal axes and decoupled from each other. The feasibility this approach
depends strongly on the laser’s modulation behavior and it is not possible to predict
whether a laser would be amenable to such methods without first characterizing it.
The 2f signal is most widely used in WMS because it appears on a nearly zero
baseline while the 1f WMS signal appears on a large non-absorbing baseline due to
I 1 term which is much larger than I 2 . The 2f line centre value which is almost
entirely dominated by the H 2 component, is approximately proportional to the mole
fraction. The scaling is strictly valid only in the optically thin approximation. Unlike
direct detection, WMS is not automatically an absolute measurement technique and
therefore the signal levels require calibration. From a practical point of view it is
much more convenient to work with the magnitude of the 2f WMS signal given by,
R 2f =
X
2
2f + Y
2
2f ,
(27)
343
Fig. 11 Phasor representation of the harmonic signal components in a 1f WMS and b 2f WMS.
The nonlinear IM is also included in this case
The general feature in these equations is that the signal recovered at the n
th harmonic is dominated by the n
th Fourier coefficient scaled by the laser intensity. However, there are additional distorting terms that bear the signatures of the lower and the
higher Fourier components that are both scaled by the laser IM (I 1 , I 2 ) and cosine
or sine of the phase difference (ψ 1 and ψ 2 ). The phasor diagrams shown in Fig. 11
help to clarify the picture although the phasors are not drawn to scale. The X-axis of
the LIA is arbitrarily defined as the detection axis. It is evident that the although the
main harmonic signal component (red) can be fully recovered by properly aligning
the detection axis, it is not the only component that is recovered. Projections of the
IM components (blue and green phasors) scaled by the cosine of the phase angles
add variable amounts of distortion the extent of which clearly depends on the values
of I 1 , I 2 , ψ 1 and ψ 2 . Note that the relative lengths and orientations of the phasors
(and therefore their projections on to the X axis) would vary because the values of
the parameters depend on the laser, the emission wavelength and most strongly f m .
The contribution of I 2 is usually small and that of ψ 2 usually negligible. It may
even be possible [49] to operate at the so-called phase quadrature frequency (f q ) at
which ψ 1 = 90
◦ and the target harmonic and the distorting terms are aligned along
the two orthogonal axes and decoupled from each other. The feasibility this approach
depends strongly on the laser’s modulation behavior and it is not possible to predict
whether a laser would be amenable to such methods without first characterizing it.
The 2f signal is most widely used in WMS because it appears on a nearly zero
baseline while the 1f WMS signal appears on a large non-absorbing baseline due to
I 1 term which is much larger than I 2 . The 2f line centre value which is almost
entirely dominated by the H 2 component, is approximately proportional to the mole
fraction. The scaling is strictly valid only in the optically thin approximation. Unlike
direct detection, WMS is not automatically an absolute measurement technique and
therefore the signal levels require calibration. From a practical point of view it is
much more convenient to work with the magnitude of the 2f WMS signal given by,
R 2f =
X
2
2f + Y
2
2f ,
(27)