

342
A. L. Chakraborty and A. Roy
required to produce a given amount of FM amplitude for the VCSEL. This would
also give rise to less IM.
The phase response of the laser forms the second part of its overall frequency
response. The phase difference ψ 1 for four lasers is plotted in Fig. 10. The VCSEL
and both QCLs show a reasonably flat phase response but the edge-emitting laser
in Fig. 10d shows remarkable variation with f m . It is some times advantageous to
be able to operate at a frequency at which ψ 1 = 90
◦ because the main n
th harmonic
term that arise due to the laser FM gets decoupled from the distorting effects of the
linear IM, and detection becomes simpler. Note that the variation of the phase along
the laser’s wavelength scan range could be significant [48] and must be included in
the simulation of the harmonic signals in that case.
4.3 Phase-Sensitive Harmonic Detection
The detection process in WMS involves the recovery of signals at various harmonics
of f m . Although the Fourier components themselves are uniquely related to the absorption line shape, the interplay of the synchronous IM and FM with the absorption line
leads to laser-specific systematic distortion of the WMS signals that are finally recovered. Equation 22 has already made this clear. Narrowband phase-sensitive detection
is performed on this signal I t to recover a particular harmonic using a lock-in amplifier (LIA) which is essentially a phase-selective ultra-narrow band-pass filter. The
ultra-narrow detection bandwidth greatly reduces the noise power that enters the
system and consequently increases the SNR by orders of magnitude. This of course
makes the detection more complex but modern embedded systems are sufficiently
powerful to be able to perform this task. The real complexity lies in extracting the gas
parameters from the distorted harmonic signals. The harmonic signals are related to
the absorption line shape through the various Fourier components of the modulated
line shape. The LIA operates by multiplying the incoming signal given by Eq. 22 by
two orthogonal local carriers cos nω m t and sin nω m t and then passing the resultant
signal through a digital low-pass filter with an adjustable time constant. The X and
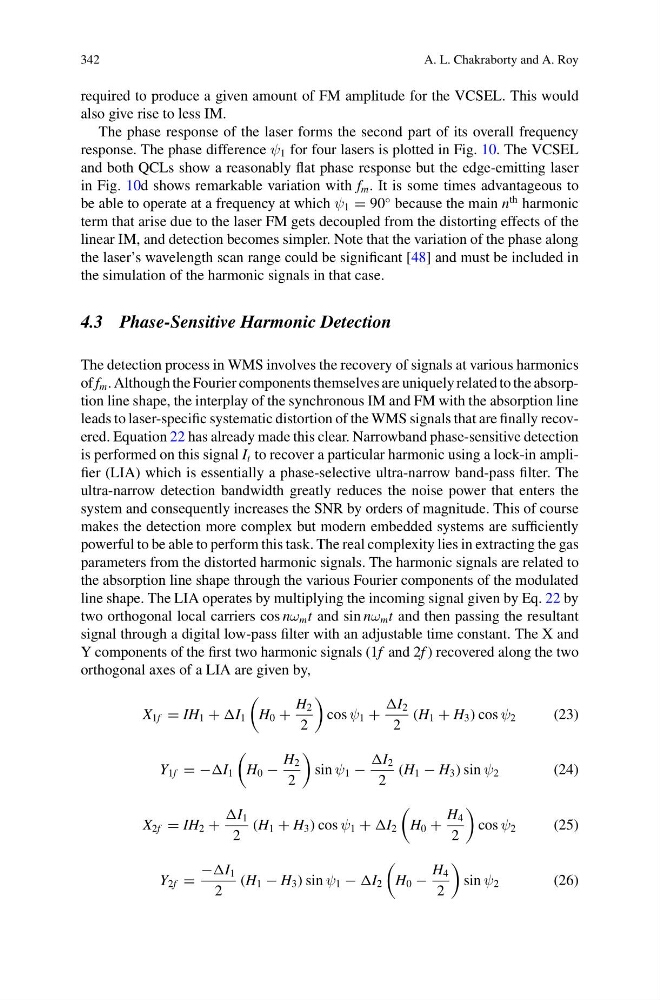
Y components of the first two harmonic signals (1f and 2f ) recovered along the two
orthogonal axes of a LIA are given by,
X 1f = IH 1 + I 1
H 0 +
H 2
2
cos ψ 1 +
I 2
2
(H 1 + H 3 ) cos ψ 2
(23)
Y 1f = −I 1
H 0 −
H 2
2
sin ψ 1 −
I 2
2
(H 1 − H 3 ) sin ψ 2
(24)
X 2f = IH 2 +
I 1
2
(H 1 + H 3 ) cos ψ 1 + I 2
H 0 +
H 4
2
cos ψ 2
(25)
Y 2f =
−I 1
2
(H 1 − H 3 ) sin ψ 1 − I 2
H 0 −
H 4
2
sin ψ 2
(26)
A. L. Chakraborty and A. Roy
required to produce a given amount of FM amplitude for the VCSEL. This would
also give rise to less IM.
The phase response of the laser forms the second part of its overall frequency
response. The phase difference ψ 1 for four lasers is plotted in Fig. 10. The VCSEL
and both QCLs show a reasonably flat phase response but the edge-emitting laser
in Fig. 10d shows remarkable variation with f m . It is some times advantageous to
be able to operate at a frequency at which ψ 1 = 90
◦ because the main n
th harmonic
term that arise due to the laser FM gets decoupled from the distorting effects of the
linear IM, and detection becomes simpler. Note that the variation of the phase along
the laser’s wavelength scan range could be significant [48] and must be included in
the simulation of the harmonic signals in that case.
4.3 Phase-Sensitive Harmonic Detection
The detection process in WMS involves the recovery of signals at various harmonics
of f m . Although the Fourier components themselves are uniquely related to the absorption line shape, the interplay of the synchronous IM and FM with the absorption line
leads to laser-specific systematic distortion of the WMS signals that are finally recovered. Equation 22 has already made this clear. Narrowband phase-sensitive detection
is performed on this signal I t to recover a particular harmonic using a lock-in amplifier (LIA) which is essentially a phase-selective ultra-narrow band-pass filter. The
ultra-narrow detection bandwidth greatly reduces the noise power that enters the
system and consequently increases the SNR by orders of magnitude. This of course
makes the detection more complex but modern embedded systems are sufficiently
powerful to be able to perform this task. The real complexity lies in extracting the gas
parameters from the distorted harmonic signals. The harmonic signals are related to
the absorption line shape through the various Fourier components of the modulated
line shape. The LIA operates by multiplying the incoming signal given by Eq. 22 by
two orthogonal local carriers cos nω m t and sin nω m t and then passing the resultant
signal through a digital low-pass filter with an adjustable time constant. The X and
Y components of the first two harmonic signals (1f and 2f ) recovered along the two
orthogonal axes of a LIA are given by,
X 1f = IH 1 + I 1
H 0 +
H 2
2
cos ψ 1 +
I 2
2
(H 1 + H 3 ) cos ψ 2
(23)
Y 1f = −I 1
H 0 −
H 2
2
sin ψ 1 −
I 2
2
(H 1 − H 3 ) sin ψ 2
(24)
X 2f = IH 2 +
I 1
2
(H 1 + H 3 ) cos ψ 1 + I 2
H 0 +
H 4
2
cos ψ 2
(25)
Y 2f =
−I 1
2
(H 1 − H 3 ) sin ψ 1 − I 2
H 0 −
H 4
2
sin ψ 2
(26)