

294
A. Maity et al.
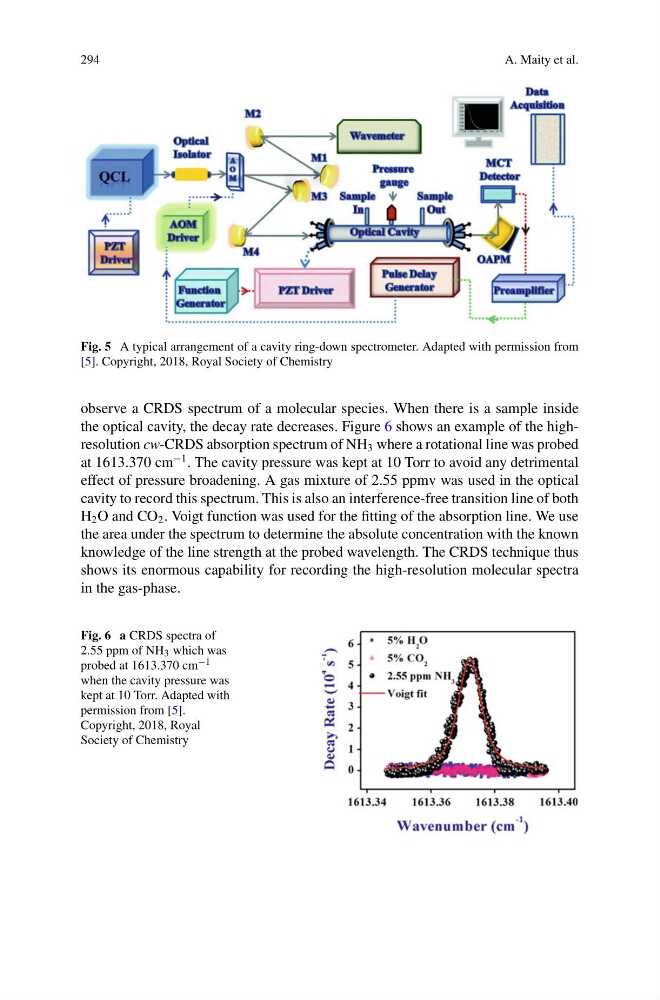
Fig. 5 A typical arrangement of a cavity ring-down spectrometer. Adapted with permission from
[5]. Copyright, 2018, Royal Society of Chemistry
observe a CRDS spectrum of a molecular species. When there is a sample inside
the optical cavity, the decay rate decreases. Figure 6 shows an example of the highresolution cw-CRDS absorption spectrum of NH 3 where a rotational line was probed
at 1613.370 cm
−1 . The cavity pressure was kept at 10 Torr to avoid any detrimental
effect of pressure broadening. A gas mixture of 2.55 ppmv was used in the optical
cavity to record this spectrum. This is also an interference-free transition line of both
H 2 O and CO 2 . Voigt function was used for the fitting of the absorption line. We use
the area under the spectrum to determine the absolute concentration with the known
knowledge of the line strength at the probed wavelength. The CRDS technique thus
shows its enormous capability for recording the high-resolution molecular spectra
in the gas-phase.
Fig. 6 a CRDS spectra of
2.55 ppm of NH 3 which was
probed at 1613.370 cm −1
when the cavity pressure was
kept at 10 Torr. Adapted with
permission from [5].
Copyright, 2018, Royal
Society of Chemistry
A. Maity et al.
Fig. 5 A typical arrangement of a cavity ring-down spectrometer. Adapted with permission from
[5]. Copyright, 2018, Royal Society of Chemistry
observe a CRDS spectrum of a molecular species. When there is a sample inside
the optical cavity, the decay rate decreases. Figure 6 shows an example of the highresolution cw-CRDS absorption spectrum of NH 3 where a rotational line was probed
at 1613.370 cm
−1 . The cavity pressure was kept at 10 Torr to avoid any detrimental
effect of pressure broadening. A gas mixture of 2.55 ppmv was used in the optical
cavity to record this spectrum. This is also an interference-free transition line of both
H 2 O and CO 2 . Voigt function was used for the fitting of the absorption line. We use
the area under the spectrum to determine the absolute concentration with the known
knowledge of the line strength at the probed wavelength. The CRDS technique thus
shows its enormous capability for recording the high-resolution molecular spectra
in the gas-phase.
Fig. 6 a CRDS spectra of
2.55 ppm of NH 3 which was
probed at 1613.370 cm −1
when the cavity pressure was
kept at 10 Torr. Adapted with
permission from [5].
Copyright, 2018, Royal
Society of Chemistry