

Cavity Ring-Down Spectroscopy
293
shown that for cw-CRDS, the light is coupled in more efficient way in the cavity, thus
provides higher signal to noise ratio (SNR) for the ring-down decay trace. However,
the light is trapped in an optical cavity only when the frequency of laser and cavity
mode is in resonance. Now, once the intra-cavity light is coupled within the cavity,
we must have to switch off the laser beam to observe the ring-down decay trace.
Usually, a fast-optical switching device, i.e. acoustic optic modulator (AOM) is used
to turn off the laser beam. A trigger circuit combined with a pulsed delay generator
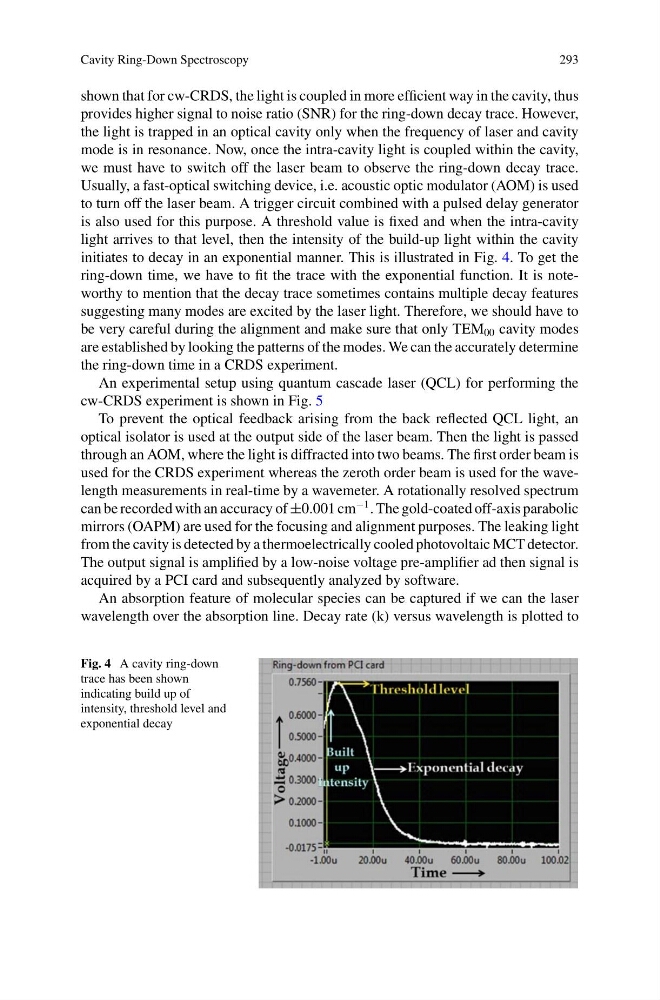
is also used for this purpose. A threshold value is fixed and when the intra-cavity
light arrives to that level, then the intensity of the build-up light within the cavity
initiates to decay in an exponential manner. This is illustrated in Fig. 4. To get the
ring-down time, we have to fit the trace with the exponential function. It is noteworthy to mention that the decay trace sometimes contains multiple decay features
suggesting many modes are excited by the laser light. Therefore, we should have to
be very careful during the alignment and make sure that only TEM 00 cavity modes
are established by looking the patterns of the modes. We can the accurately determine
the ring-down time in a CRDS experiment.
An experimental setup using quantum cascade laser (QCL) for performing the
cw-CRDS experiment is shown in Fig. 5
To prevent the optical feedback arising from the back reflected QCL light, an
optical isolator is used at the output side of the laser beam. Then the light is passed
through an AOM, where the light is diffracted into two beams. The first order beam is
used for the CRDS experiment whereas the zeroth order beam is used for the wavelength measurements in real-time by a wavemeter. A rotationally resolved spectrum
can be recorded with an accuracy of ±0.001 cm
−1 . The gold-coated off-axis parabolic
mirrors (OAPM) are used for the focusing and alignment purposes. The leaking light
from the cavity is detected by a thermoelectrically cooled photovoltaic MCT detector.
The output signal is amplified by a low-noise voltage pre-amplifier ad then signal is
acquired by a PCI card and subsequently analyzed by software.
An absorption feature of molecular species can be captured if we can the laser
wavelength over the absorption line. Decay rate (k) versus wavelength is plotted to
Fig. 4 A cavity ring-down
trace has been shown
indicating build up of
intensity, threshold level and
exponential decay
293
shown that for cw-CRDS, the light is coupled in more efficient way in the cavity, thus
provides higher signal to noise ratio (SNR) for the ring-down decay trace. However,
the light is trapped in an optical cavity only when the frequency of laser and cavity
mode is in resonance. Now, once the intra-cavity light is coupled within the cavity,
we must have to switch off the laser beam to observe the ring-down decay trace.
Usually, a fast-optical switching device, i.e. acoustic optic modulator (AOM) is used
to turn off the laser beam. A trigger circuit combined with a pulsed delay generator
is also used for this purpose. A threshold value is fixed and when the intra-cavity
light arrives to that level, then the intensity of the build-up light within the cavity
initiates to decay in an exponential manner. This is illustrated in Fig. 4. To get the
ring-down time, we have to fit the trace with the exponential function. It is noteworthy to mention that the decay trace sometimes contains multiple decay features
suggesting many modes are excited by the laser light. Therefore, we should have to
be very careful during the alignment and make sure that only TEM 00 cavity modes
are established by looking the patterns of the modes. We can the accurately determine
the ring-down time in a CRDS experiment.
An experimental setup using quantum cascade laser (QCL) for performing the
cw-CRDS experiment is shown in Fig. 5
To prevent the optical feedback arising from the back reflected QCL light, an
optical isolator is used at the output side of the laser beam. Then the light is passed
through an AOM, where the light is diffracted into two beams. The first order beam is
used for the CRDS experiment whereas the zeroth order beam is used for the wavelength measurements in real-time by a wavemeter. A rotationally resolved spectrum
can be recorded with an accuracy of ±0.001 cm
−1 . The gold-coated off-axis parabolic
mirrors (OAPM) are used for the focusing and alignment purposes. The leaking light
from the cavity is detected by a thermoelectrically cooled photovoltaic MCT detector.
The output signal is amplified by a low-noise voltage pre-amplifier ad then signal is
acquired by a PCI card and subsequently analyzed by software.
An absorption feature of molecular species can be captured if we can the laser
wavelength over the absorption line. Decay rate (k) versus wavelength is plotted to
Fig. 4 A cavity ring-down
trace has been shown
indicating build up of
intensity, threshold level and
exponential decay