

282
P. Madhusudhan et al.
ness of the image is maximum is the polarization axis of light. The arcs along the
polarization axis are the VMI rings that represent particles of specific momentum.
The ions or electrons produced in the interaction region have velocity vectors in
all directions, forming three-dimensional (3D) Newton spheres. The radii of these
spheres are directly proportional to the kinetic energies of the charged particles. The
information on light-matter interaction is revealed by analyzing the velocity vector
distribution on the Newton sphere. In the VMI spectrometer, the 3D velocity Newton
sphere is projected onto the 2D detector. This event is termed as ‘pancaking’or ‘ion
sphere crushing’. In this detection method, the detector records the 2D velocity information (v x , v y ) of the ions/electrons. However, the third dimension of the velocity
vector (v z ) is projected onto a 2D image, which can be extracted using the Inverse
Abel Transform method. For details of Abel transform, the readers may go through
the original paper of Abel [64]. The readers should note that this method also generates some noise, which may affect the overall resolution of the spectrometer. The
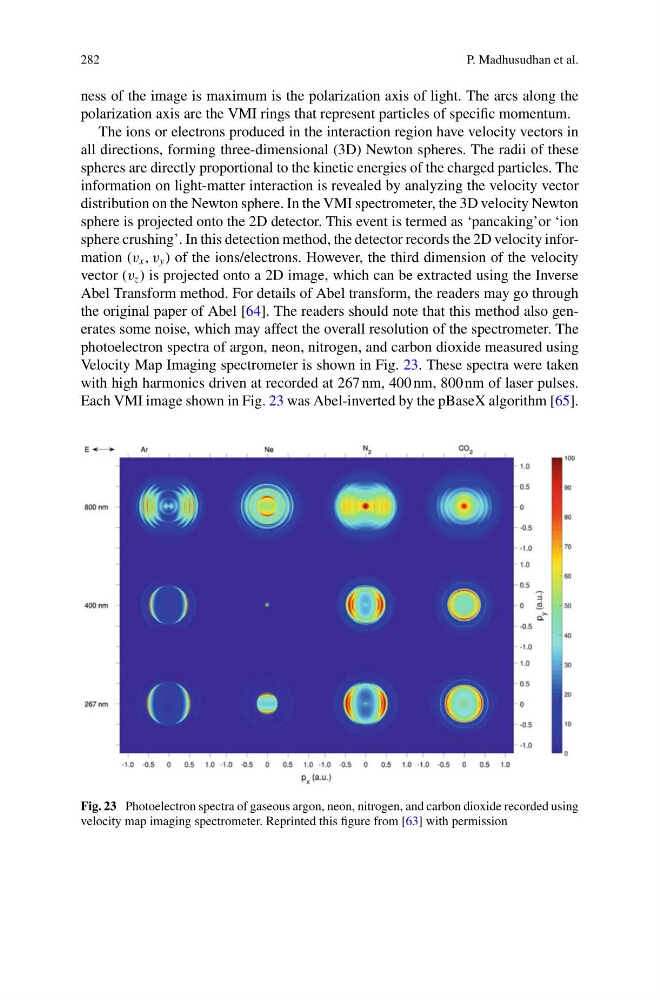
photoelectron spectra of argon, neon, nitrogen, and carbon dioxide measured using
Velocity Map Imaging spectrometer is shown in Fig. 23. These spectra were taken
with high harmonics driven at recorded at 267 nm, 400 nm, 800 nm of laser pulses.
Each VMI image shown in Fig. 23 was Abel-inverted by the pBaseX algorithm [65].
Fig. 23 Photoelectron spectra of gaseous argon, neon, nitrogen, and carbon dioxide recorded using
velocity map imaging spectrometer. Reprinted this figure from [63] with permission
P. Madhusudhan et al.
ness of the image is maximum is the polarization axis of light. The arcs along the
polarization axis are the VMI rings that represent particles of specific momentum.
The ions or electrons produced in the interaction region have velocity vectors in
all directions, forming three-dimensional (3D) Newton spheres. The radii of these
spheres are directly proportional to the kinetic energies of the charged particles. The
information on light-matter interaction is revealed by analyzing the velocity vector
distribution on the Newton sphere. In the VMI spectrometer, the 3D velocity Newton
sphere is projected onto the 2D detector. This event is termed as ‘pancaking’or ‘ion
sphere crushing’. In this detection method, the detector records the 2D velocity information (v x , v y ) of the ions/electrons. However, the third dimension of the velocity
vector (v z ) is projected onto a 2D image, which can be extracted using the Inverse
Abel Transform method. For details of Abel transform, the readers may go through
the original paper of Abel [64]. The readers should note that this method also generates some noise, which may affect the overall resolution of the spectrometer. The
photoelectron spectra of argon, neon, nitrogen, and carbon dioxide measured using
Velocity Map Imaging spectrometer is shown in Fig. 23. These spectra were taken
with high harmonics driven at recorded at 267 nm, 400 nm, 800 nm of laser pulses.
Each VMI image shown in Fig. 23 was Abel-inverted by the pBaseX algorithm [65].
Fig. 23 Photoelectron spectra of gaseous argon, neon, nitrogen, and carbon dioxide recorded using
velocity map imaging spectrometer. Reprinted this figure from [63] with permission