

Modern Experimental Techniques in Ultrafast Atomic …
267
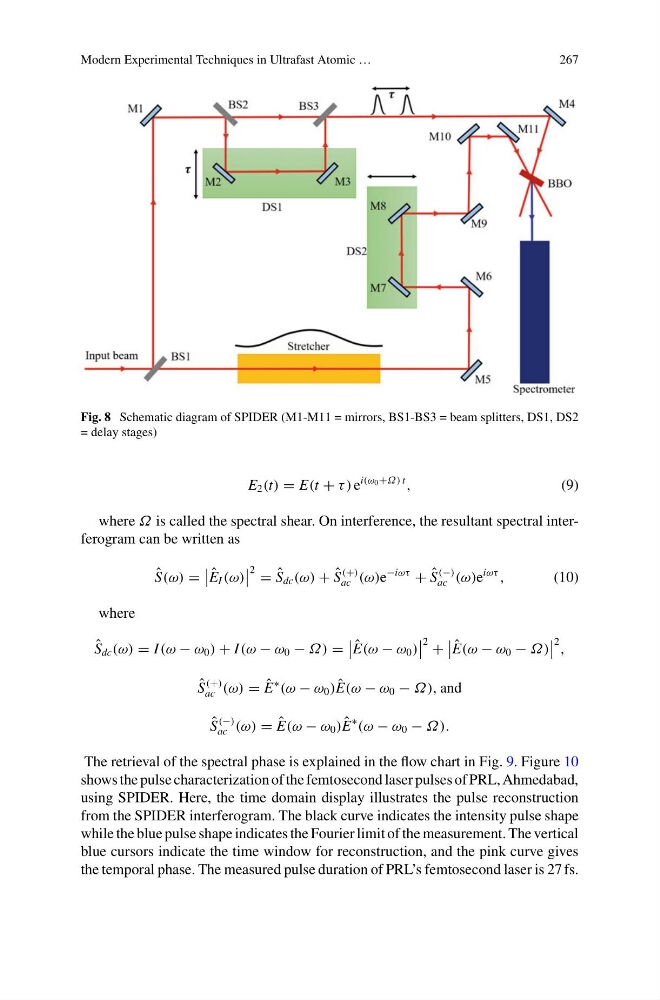
Fig. 8 Schematic diagram of SPIDER (M1-M11 = mirrors, BS1-BS3 = beam splitters, DS1, DS2
= delay stages)
E 2 (t) = E(t + τ ) e
i(ω 0 +Ω) t
,
(9)
where Ω is called the spectral shear. On interference, the resultant spectral interferogram can be written as
ˆ
S(ω) =
ˆ
E I (ω)
2 = ˆ
S dc (ω) + ˆ
S
(+)
ac (ω)e
−iωτ
+ ˆ
S
(−)
ac (ω)e
iωτ
,
(10)
where
ˆ
S dc (ω) = I (ω − ω 0 ) + I (ω − ω 0 − Ω) =
ˆ
E(ω − ω 0 )
2 +
ˆ
E(ω − ω 0 − Ω)
2 ,
ˆ
S
(+)
ac (ω) = ˆ
E
∗
(ω − ω 0 ) ˆ
E(ω − ω 0 − Ω), and
ˆ
S
(−)
ac (ω) = ˆ
E(ω − ω 0 ) ˆ
E
∗
(ω − ω 0 − Ω).
The retrieval of the spectral phase is explained in the flow chart in Fig. 9. Figure 10
shows the pulse characterization of the femtosecond laser pulses of PRL, Ahmedabad,
using SPIDER. Here, the time domain display illustrates the pulse reconstruction
from the SPIDER interferogram. The black curve indicates the intensity pulse shape
while the blue pulse shape indicates the Fourier limit of the measurement. The vertical
blue cursors indicate the time window for reconstruction, and the pink curve gives
the temporal phase. The measured pulse duration of PRL’s femtosecond laser is 27 fs.
267
Fig. 8 Schematic diagram of SPIDER (M1-M11 = mirrors, BS1-BS3 = beam splitters, DS1, DS2
= delay stages)
E 2 (t) = E(t + τ ) e
i(ω 0 +Ω) t
,
(9)
where Ω is called the spectral shear. On interference, the resultant spectral interferogram can be written as
ˆ
S(ω) =
ˆ
E I (ω)
2 = ˆ
S dc (ω) + ˆ
S
(+)
ac (ω)e
−iωτ
+ ˆ
S
(−)
ac (ω)e
iωτ
,
(10)
where
ˆ
S dc (ω) = I (ω − ω 0 ) + I (ω − ω 0 − Ω) =
ˆ
E(ω − ω 0 )
2 +
ˆ
E(ω − ω 0 − Ω)
2 ,
ˆ
S
(+)
ac (ω) = ˆ
E
∗
(ω − ω 0 ) ˆ
E(ω − ω 0 − Ω), and
ˆ
S
(−)
ac (ω) = ˆ
E(ω − ω 0 ) ˆ
E
∗
(ω − ω 0 − Ω).
The retrieval of the spectral phase is explained in the flow chart in Fig. 9. Figure 10
shows the pulse characterization of the femtosecond laser pulses of PRL, Ahmedabad,
using SPIDER. Here, the time domain display illustrates the pulse reconstruction
from the SPIDER interferogram. The black curve indicates the intensity pulse shape
while the blue pulse shape indicates the Fourier limit of the measurement. The vertical
blue cursors indicate the time window for reconstruction, and the pink curve gives
the temporal phase. The measured pulse duration of PRL’s femtosecond laser is 27 fs.