

204
B. P. Majee and A. K. Mishra
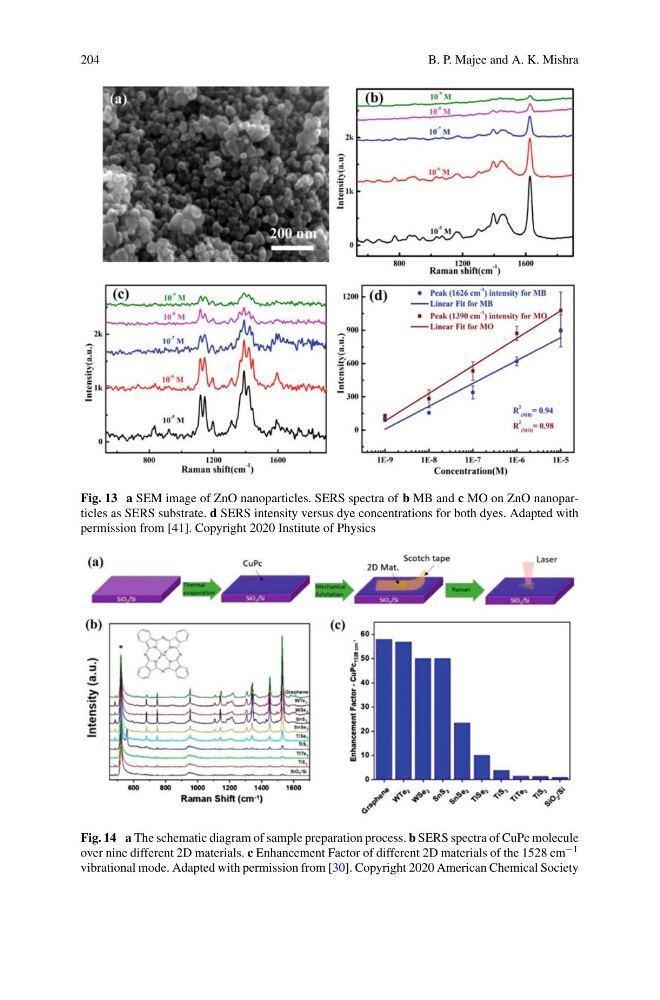
Fig. 13 a SEM image of ZnO nanoparticles. SERS spectra of b MB and c MO on ZnO nanoparticles as SERS substrate. d SERS intensity versus dye concentrations for both dyes. Adapted with
permission from [41]. Copyright 2020 Institute of Physics
Fig. 14 a The schematic diagram of sample preparation process. b SERS spectra of CuPc molecule
over nine different 2D materials. c Enhancement Factor of different 2D materials of the 1528 cm −1
vibrational mode. Adapted with permission from [30]. Copyright 2020 American Chemical Society
B. P. Majee and A. K. Mishra
Fig. 13 a SEM image of ZnO nanoparticles. SERS spectra of b MB and c MO on ZnO nanoparticles as SERS substrate. d SERS intensity versus dye concentrations for both dyes. Adapted with
permission from [41]. Copyright 2020 Institute of Physics
Fig. 14 a The schematic diagram of sample preparation process. b SERS spectra of CuPc molecule
over nine different 2D materials. c Enhancement Factor of different 2D materials of the 1528 cm −1
vibrational mode. Adapted with permission from [30]. Copyright 2020 American Chemical Society