

Fundamentals and Applications of Surface Enhanced Raman …
203
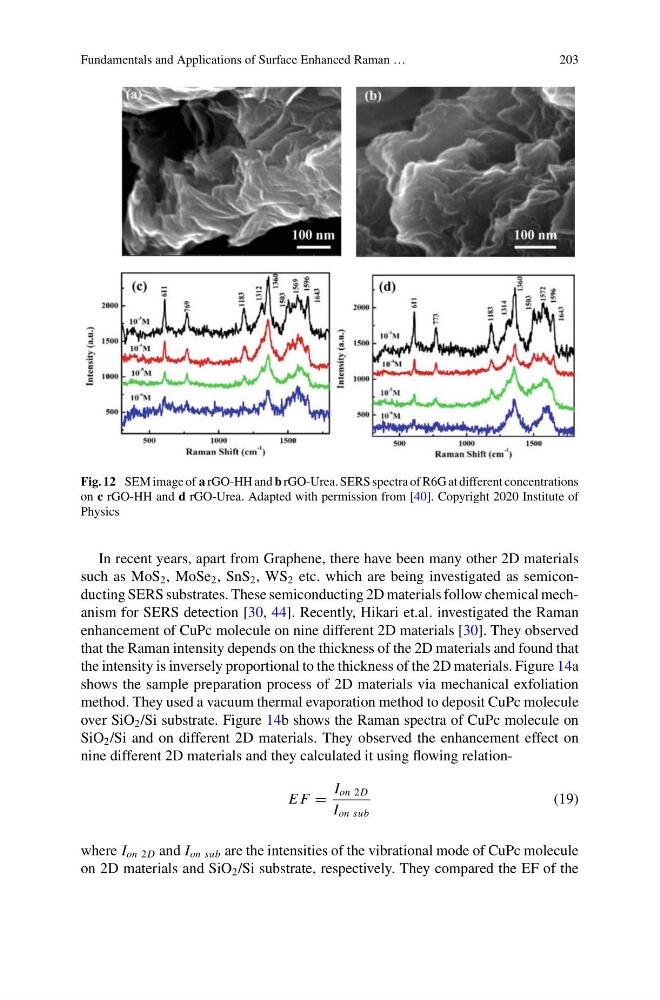
Fig. 12 SEM image of a rGO-HH and b rGO-Urea. SERS spectra of R6G at different concentrations
on c rGO-HH and d rGO-Urea. Adapted with permission from [40]. Copyright 2020 Institute of
Physics
In recent years, apart from Graphene, there have been many other 2D materials
such as MoS 2 , MoSe 2 , SnS 2 , WS 2 etc. which are being investigated as semiconducting SERS substrates. These semiconducting 2D materials follow chemical mechanism for SERS detection [30, 44]. Recently, Hikari et.al. investigated the Raman
enhancement of CuPc molecule on nine different 2D materials [30]. They observed
that the Raman intensity depends on the thickness of the 2D materials and found that
the intensity is inversely proportional to the thickness of the 2D materials. Figure 14a
shows the sample preparation process of 2D materials via mechanical exfoliation
method. They used a vacuum thermal evaporation method to deposit CuPc molecule
over SiO 2 /Si substrate. Figure 14b shows the Raman spectra of CuPc molecule on
SiO 2 /Si and on different 2D materials. They observed the enhancement effect on
nine different 2D materials and they calculated it using flowing relationE F =
I on 2D
I on sub
(19)
where I on 2D and I on sub are the intensities of the vibrational mode of CuPc molecule
on 2D materials and SiO 2 /Si substrate, respectively. They compared the EF of the
203
Fig. 12 SEM image of a rGO-HH and b rGO-Urea. SERS spectra of R6G at different concentrations
on c rGO-HH and d rGO-Urea. Adapted with permission from [40]. Copyright 2020 Institute of
Physics
In recent years, apart from Graphene, there have been many other 2D materials
such as MoS 2 , MoSe 2 , SnS 2 , WS 2 etc. which are being investigated as semiconducting SERS substrates. These semiconducting 2D materials follow chemical mechanism for SERS detection [30, 44]. Recently, Hikari et.al. investigated the Raman
enhancement of CuPc molecule on nine different 2D materials [30]. They observed
that the Raman intensity depends on the thickness of the 2D materials and found that
the intensity is inversely proportional to the thickness of the 2D materials. Figure 14a
shows the sample preparation process of 2D materials via mechanical exfoliation
method. They used a vacuum thermal evaporation method to deposit CuPc molecule
over SiO 2 /Si substrate. Figure 14b shows the Raman spectra of CuPc molecule on
SiO 2 /Si and on different 2D materials. They observed the enhancement effect on
nine different 2D materials and they calculated it using flowing relationE F =
I on 2D
I on sub
(19)
where I on 2D and I on sub are the intensities of the vibrational mode of CuPc molecule
on 2D materials and SiO 2 /Si substrate, respectively. They compared the EF of the