

100
S. Roy et al.
the quartz. The frequency domain signals (interference patterns) are converted into
time domain by Fourier transformation (Fig. 6b); the signal at t = 0 represents
the squared terms in Eq. 20, while the cross terms, E S E
∗
L O,S r L O r
∗
S(V I S) r
∗
S(I R) e
iωωt
and E
∗
S E L O,S r
∗
L O r S(V I S) r S(I R) e
−iωωt appear at the time +t and −t, respectively.
The cross-term at +t
i.e., E S E
∗
L O,S r Ls O r
∗
S(V I S) r
∗
S(I R) e
iωωt
is extracted by multiplying with a suitable filter function (purple box function in Fig. 6b). A similar
term E Q E
∗
L O,Q r L O r
∗
Q(V I S) r
∗
Q(I R) e
iωωt is also obtained from the quartz surface. The
extracted heterodyne components are transformed back to the frequency domain by
inverse Fourier transformation (Fig. 6c).
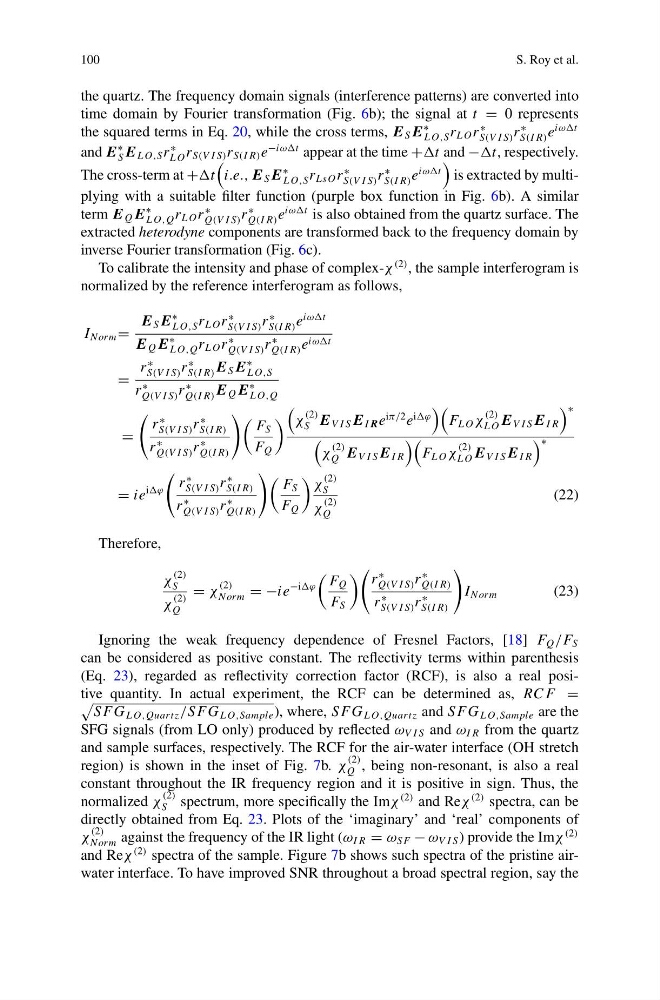
To calibrate the intensity and phase of complex-χ
(2) , the sample interferogram is
normalized by the reference interferogram as follows,
I Norm =
E S E
∗
L O,S r L O r
∗
S(V I S) r
∗
S(I R) e
iωωt
E Q E
∗
L O,Q r L O r
∗
Q(V I S) r
∗
Q(I R) e iωωt
=
r
∗
S(V I S) r
∗
S(I R) E S E
∗
L O,S
r
∗
Q(V I S) r
∗
Q(I R) E Q E
∗
L O,Q
=
r
∗
S(V I S) r
∗
S(I R)
r
∗
Q(V I S) r
∗
Q(I R)
F S
F Q
χ
(2)
S E V I S E I R e
iπ/2 e
iϕ
F L O χ
(2)
L O E V I S E I R
∗
χ
(2)
Q E V I S E I R
F L O χ
(2)
L O E V I S E I R
∗
= ie
iϕ
r
∗
S(V I S) r
∗
S(I R)
r
∗
Q(V I S) r
∗
Q(I R)
F S
F Q
χ
(2)
S
χ
(2)
Q
(22)
Therefore,
χ
(2)
S
χ
(2)
Q
= χ
(2)
Norm = −ie
−iϕ
F Q
F S
r
∗
Q(V I S) r
∗
Q(I R)
r
∗
S(V I S) r
∗
S(I R)
I Norm
(23)
Ignoring the weak frequency dependence of Fresnel Factors, [18] F Q /F S
can be considered as positive constant. The reflectivity terms within parenthesis
(Eq. 23), regarded as reflectivity correction factor (RCF), is also a real positive quantity. In actual experiment, the RCF can be determined as, RC F =
S F G L O,Quart z /S F G L O,Sample ), where, S F G L O,Quart z and S F G L O,Sample are the
SFG signals (from LO only) produced by reflected ω V I S and ω I R from the quartz
and sample surfaces, respectively. The RCF for the air-water interface (OH stretch
region) is shown in the inset of Fig. 7b. χ
(2)
Q , being non-resonant, is also a real
constant throughout the IR frequency region and it is positive in sign. Thus, the
normalized χ
(2)
S spectrum, more specifically the Imχ
(2) and Reχ
(2) spectra, can be
directly obtained from Eq. 23. Plots of the ‘imaginary’ and ‘real’ components of
χ
(2)
Norm against the frequency of the IR light (ω I R = ω SF − ω V I S ) provide the Imχ
(2)
and Reχ
(2) spectra of the sample. Figure 7b shows such spectra of the pristine airwater interface. To have improved SNR throughout a broad spectral region, say the
S. Roy et al.
the quartz. The frequency domain signals (interference patterns) are converted into
time domain by Fourier transformation (Fig. 6b); the signal at t = 0 represents
the squared terms in Eq. 20, while the cross terms, E S E
∗
L O,S r L O r
∗
S(V I S) r
∗
S(I R) e
iωωt
and E
∗
S E L O,S r
∗
L O r S(V I S) r S(I R) e
−iωωt appear at the time +t and −t, respectively.
The cross-term at +t
i.e., E S E
∗
L O,S r Ls O r
∗
S(V I S) r
∗
S(I R) e
iωωt
is extracted by multiplying with a suitable filter function (purple box function in Fig. 6b). A similar
term E Q E
∗
L O,Q r L O r
∗
Q(V I S) r
∗
Q(I R) e
iωωt is also obtained from the quartz surface. The
extracted heterodyne components are transformed back to the frequency domain by
inverse Fourier transformation (Fig. 6c).
To calibrate the intensity and phase of complex-χ
(2) , the sample interferogram is
normalized by the reference interferogram as follows,
I Norm =
E S E
∗
L O,S r L O r
∗
S(V I S) r
∗
S(I R) e
iωωt
E Q E
∗
L O,Q r L O r
∗
Q(V I S) r
∗
Q(I R) e iωωt
=
r
∗
S(V I S) r
∗
S(I R) E S E
∗
L O,S
r
∗
Q(V I S) r
∗
Q(I R) E Q E
∗
L O,Q
=
r
∗
S(V I S) r
∗
S(I R)
r
∗
Q(V I S) r
∗
Q(I R)
F S
F Q
χ
(2)
S E V I S E I R e
iπ/2 e
iϕ
F L O χ
(2)
L O E V I S E I R
∗
χ
(2)
Q E V I S E I R
F L O χ
(2)
L O E V I S E I R
∗
= ie
iϕ
r
∗
S(V I S) r
∗
S(I R)
r
∗
Q(V I S) r
∗
Q(I R)
F S
F Q
χ
(2)
S
χ
(2)
Q
(22)
Therefore,
χ
(2)
S
χ
(2)
Q
= χ
(2)
Norm = −ie
−iϕ
F Q
F S
r
∗
Q(V I S) r
∗
Q(I R)
r
∗
S(V I S) r
∗
S(I R)
I Norm
(23)
Ignoring the weak frequency dependence of Fresnel Factors, [18] F Q /F S
can be considered as positive constant. The reflectivity terms within parenthesis
(Eq. 23), regarded as reflectivity correction factor (RCF), is also a real positive quantity. In actual experiment, the RCF can be determined as, RC F =
S F G L O,Quart z /S F G L O,Sample ), where, S F G L O,Quart z and S F G L O,Sample are the
SFG signals (from LO only) produced by reflected ω V I S and ω I R from the quartz
and sample surfaces, respectively. The RCF for the air-water interface (OH stretch
region) is shown in the inset of Fig. 7b. χ
(2)
Q , being non-resonant, is also a real
constant throughout the IR frequency region and it is positive in sign. Thus, the
normalized χ
(2)
S spectrum, more specifically the Imχ
(2) and Reχ
(2) spectra, can be
directly obtained from Eq. 23. Plots of the ‘imaginary’ and ‘real’ components of
χ
(2)
Norm against the frequency of the IR light (ω I R = ω SF − ω V I S ) provide the Imχ
(2)
and Reχ
(2) spectra of the sample. Figure 7b shows such spectra of the pristine airwater interface. To have improved SNR throughout a broad spectral region, say the