

Classical- and Heterodyne-Detected Vibrational Sum …
101
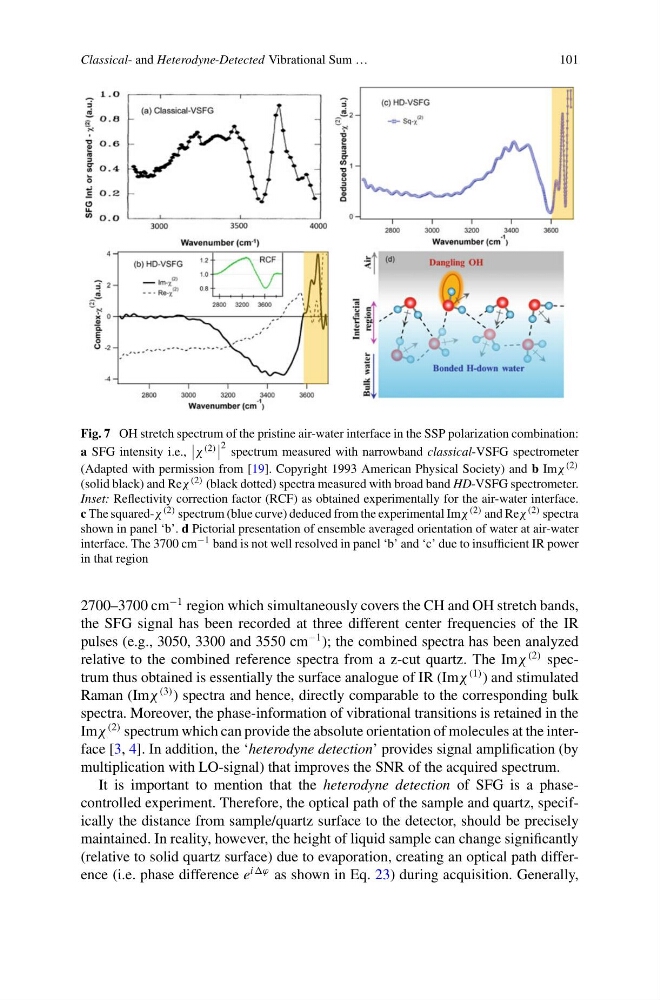
Fig. 7 OH stretch spectrum of the pristine air-water interface in the SSP polarization combination:
a SFG intensity i.e.,
χ (2)
2 spectrum measured with narrowband classical-VSFG spectrometer
(Adapted with permission from [19]. Copyright 1993 American Physical Society) and b Imχ (2)
(solid black) and Reχ (2) (black dotted) spectra measured with broad band HD-VSFG spectrometer.
Inset: Reflectivity correction factor (RCF) as obtained experimentally for the air-water interface.
c The squared-χ (2) spectrum (blue curve) deduced from the experimental Imχ (2) and Reχ (2) spectra
shown in panel ‘b’. d Pictorial presentation of ensemble averaged orientation of water at air-water
interface. The 3700 cm −1 band is not well resolved in panel ‘b’ and ‘c’ due to insufficient IR power
in that region
2700–3700 cm
−1 region which simultaneously covers the CH and OH stretch bands,
the SFG signal has been recorded at three different center frequencies of the IR
pulses (e.g., 3050, 3300 and 3550 cm
−1 ); the combined spectra has been analyzed
relative to the combined reference spectra from a z-cut quartz. The Imχ
(2) spectrum thus obtained is essentially the surface analogue of IR (Imχ
(1) ) and stimulated
Raman (Imχ
(3) ) spectra and hence, directly comparable to the corresponding bulk
spectra. Moreover, the phase-information of vibrational transitions is retained in the
Imχ
(2) spectrum which can provide the absolute orientation of molecules at the interface [3, 4]. In addition, the ‘heterodyne detection’ provides signal amplification (by
multiplication with LO-signal) that improves the SNR of the acquired spectrum.
It is important to mention that the heterodyne detection of SFG is a phasecontrolled experiment. Therefore, the optical path of the sample and quartz, specifically the distance from sample/quartz surface to the detector, should be precisely
maintained. In reality, however, the height of liquid sample can change significantly
(relative to solid quartz surface) due to evaporation, creating an optical path difference (i.e. phase difference e
iϕ as shown in Eq. 23) during acquisition. Generally,
101
Fig. 7 OH stretch spectrum of the pristine air-water interface in the SSP polarization combination:
a SFG intensity i.e.,
χ (2)
2 spectrum measured with narrowband classical-VSFG spectrometer
(Adapted with permission from [19]. Copyright 1993 American Physical Society) and b Imχ (2)
(solid black) and Reχ (2) (black dotted) spectra measured with broad band HD-VSFG spectrometer.
Inset: Reflectivity correction factor (RCF) as obtained experimentally for the air-water interface.
c The squared-χ (2) spectrum (blue curve) deduced from the experimental Imχ (2) and Reχ (2) spectra
shown in panel ‘b’. d Pictorial presentation of ensemble averaged orientation of water at air-water
interface. The 3700 cm −1 band is not well resolved in panel ‘b’ and ‘c’ due to insufficient IR power
in that region
2700–3700 cm
−1 region which simultaneously covers the CH and OH stretch bands,
the SFG signal has been recorded at three different center frequencies of the IR
pulses (e.g., 3050, 3300 and 3550 cm
−1 ); the combined spectra has been analyzed
relative to the combined reference spectra from a z-cut quartz. The Imχ
(2) spectrum thus obtained is essentially the surface analogue of IR (Imχ
(1) ) and stimulated
Raman (Imχ
(3) ) spectra and hence, directly comparable to the corresponding bulk
spectra. Moreover, the phase-information of vibrational transitions is retained in the
Imχ
(2) spectrum which can provide the absolute orientation of molecules at the interface [3, 4]. In addition, the ‘heterodyne detection’ provides signal amplification (by
multiplication with LO-signal) that improves the SNR of the acquired spectrum.
It is important to mention that the heterodyne detection of SFG is a phasecontrolled experiment. Therefore, the optical path of the sample and quartz, specifically the distance from sample/quartz surface to the detector, should be precisely
maintained. In reality, however, the height of liquid sample can change significantly
(relative to solid quartz surface) due to evaporation, creating an optical path difference (i.e. phase difference e
iϕ as shown in Eq. 23) during acquisition. Generally,