

98
S. Roy et al.
@ 3400 cm
−1 ) using an optical parametric amplifier (OPA) followed by a difference
frequency generator (DFG). The ω 1 pulse is passed through a translation stage (to
adjust time zero relative to the IR pulse) and focused (L1; f = 50 cm) onto the sample
surface. The ω I R is focused (L2; f = 10 cm; ∼6 μJ/pulse) onto the sample surface at
the same spot as that of the ω V I S . The incident angles of the visible and IR beams are
∼52° and ∼60° respectively. The sum frequency, ω SF = ω V I S + ω I R , is generated
at ∼54° in the incident plane.
For the heterodyne detection of the sample sum frequency, it is mixed with an LOsignal which has a constant phase-difference from that of the former. In the present
set-up (Fig. 5), the reflected ω V I S and ω I R from the sample surface are refocused
(CM, f = 10 cm) on a GaAs (110) wafer to generate the LO signal (SF LO ). A constant
phase-difference i.e., path difference (∼2 ps) is introduced between the SF S and SF LO ,
by selectively passing the former through a 1.0 mm thick anti-reflection coated glass
plate (GP) located in between the sample and the concave mirror (CM). Since glass
has higher refractive index than air, SF S is delayed in time domain (i.e., less velocity)
compare to the reflected ω V I S and ω I R , and hence, to the SF LO . Both the signals are
then collimated by a lens (L3, f = 10 cm) and focused at the slit of the spectrograph
using another lens (L4, f = 6 cm). The mixing of temporally separated SF S and SF LO
after the dispersion in spectrograph, creates an interference pattern which is detected
by a thermoelectric cooled (−70 °C) CCD detector. For the intensity and phase
calibration, a similar interference pattern is recorded by replacing the sample with a
z-cut quartz. The relatively tight focusing, spatiotemporal overlap (focusing at same
spot and with zero-time difference between the pulses) of ω V I S and ω I R and their
coplanarity are some of the critical considerations for efficient generation of SFG
signal from the sample (or reference) and LO-substrate and subsequent detection of
the interferogram. The height of the sample and the z-cut quartz is maintained using
a laser displacement sensor with a resolution of ~100 nm. The precise control of the
sample height is necessary to retain the phase information of the sample SFG relative
to that of the reference quartz.
4.1 Extraction of Imχ (2) and Reχ (2) Spectra from HD-VSFG
Signal
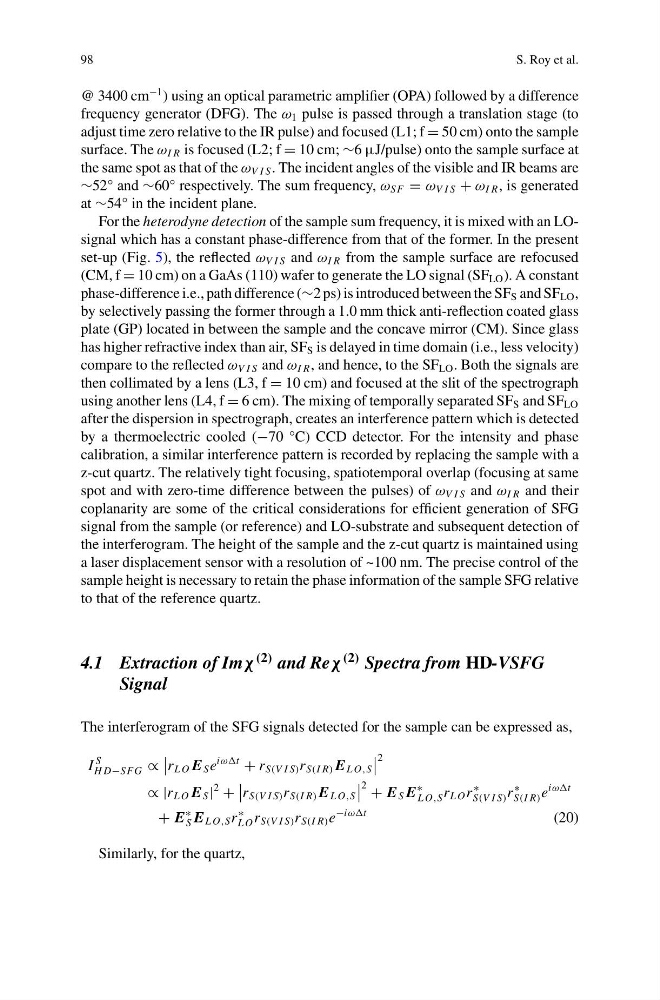
The interferogram of the SFG signals detected for the sample can be expressed as,
I
S
H D−SFG ∝
r L O E S e
iωωt
+ r S(V I S) r S(I R) E L O,S
2
∝ |r L O E S |
2
+
r S(V I S) r S(I R) E L O,S
2 + E S E
∗
L O,S r L O r
∗
S(V I S) r
∗
S(I R) e
iωωt
+ E
∗
S E L O,S r
∗
L O r S(V I S) r S(I R) e
−iωωt
(20)
Similarly, for the quartz,
S. Roy et al.
@ 3400 cm
−1 ) using an optical parametric amplifier (OPA) followed by a difference
frequency generator (DFG). The ω 1 pulse is passed through a translation stage (to
adjust time zero relative to the IR pulse) and focused (L1; f = 50 cm) onto the sample
surface. The ω I R is focused (L2; f = 10 cm; ∼6 μJ/pulse) onto the sample surface at
the same spot as that of the ω V I S . The incident angles of the visible and IR beams are
∼52° and ∼60° respectively. The sum frequency, ω SF = ω V I S + ω I R , is generated
at ∼54° in the incident plane.
For the heterodyne detection of the sample sum frequency, it is mixed with an LOsignal which has a constant phase-difference from that of the former. In the present
set-up (Fig. 5), the reflected ω V I S and ω I R from the sample surface are refocused
(CM, f = 10 cm) on a GaAs (110) wafer to generate the LO signal (SF LO ). A constant
phase-difference i.e., path difference (∼2 ps) is introduced between the SF S and SF LO ,
by selectively passing the former through a 1.0 mm thick anti-reflection coated glass
plate (GP) located in between the sample and the concave mirror (CM). Since glass
has higher refractive index than air, SF S is delayed in time domain (i.e., less velocity)
compare to the reflected ω V I S and ω I R , and hence, to the SF LO . Both the signals are
then collimated by a lens (L3, f = 10 cm) and focused at the slit of the spectrograph
using another lens (L4, f = 6 cm). The mixing of temporally separated SF S and SF LO
after the dispersion in spectrograph, creates an interference pattern which is detected
by a thermoelectric cooled (−70 °C) CCD detector. For the intensity and phase
calibration, a similar interference pattern is recorded by replacing the sample with a
z-cut quartz. The relatively tight focusing, spatiotemporal overlap (focusing at same
spot and with zero-time difference between the pulses) of ω V I S and ω I R and their
coplanarity are some of the critical considerations for efficient generation of SFG
signal from the sample (or reference) and LO-substrate and subsequent detection of
the interferogram. The height of the sample and the z-cut quartz is maintained using
a laser displacement sensor with a resolution of ~100 nm. The precise control of the
sample height is necessary to retain the phase information of the sample SFG relative
to that of the reference quartz.
4.1 Extraction of Imχ (2) and Reχ (2) Spectra from HD-VSFG
Signal
The interferogram of the SFG signals detected for the sample can be expressed as,
I
S
H D−SFG ∝
r L O E S e
iωωt
+ r S(V I S) r S(I R) E L O,S
2
∝ |r L O E S |
2
+
r S(V I S) r S(I R) E L O,S
2 + E S E
∗
L O,S r L O r
∗
S(V I S) r
∗
S(I R) e
iωωt
+ E
∗
S E L O,S r
∗
L O r S(V I S) r S(I R) e
−iωωt
(20)
Similarly, for the quartz,