

Railroad Design and Train Spill Grain Data
Three additional variables were measured at the starting location of each perpendicular transect. The mean right-of-way width (ROW mean ) was measured using a
Bushnell
® Yardage Pro
® 1,000 range finder (Bushnell Corporation, Denver, CO),
which extended to the forest edge or open water. A maximum distance of 500 m was
imposed in locations where open habitat and level ground resulted in an unidentifiable
ROW corridor. Topography adjacent to the railroad was classified into three categories similar to those used to assess wildlife-vehicle collisions on the parallel
Trans-Canada Highway (Clevenger et al. 2003; Gunson et al. 2006)
(VERGESLOPE): (0) flat; (1) raised and partly raised; and (2) buried, buried-raised,
and partly buried. Train-spilled grain was also measured at each transect starting
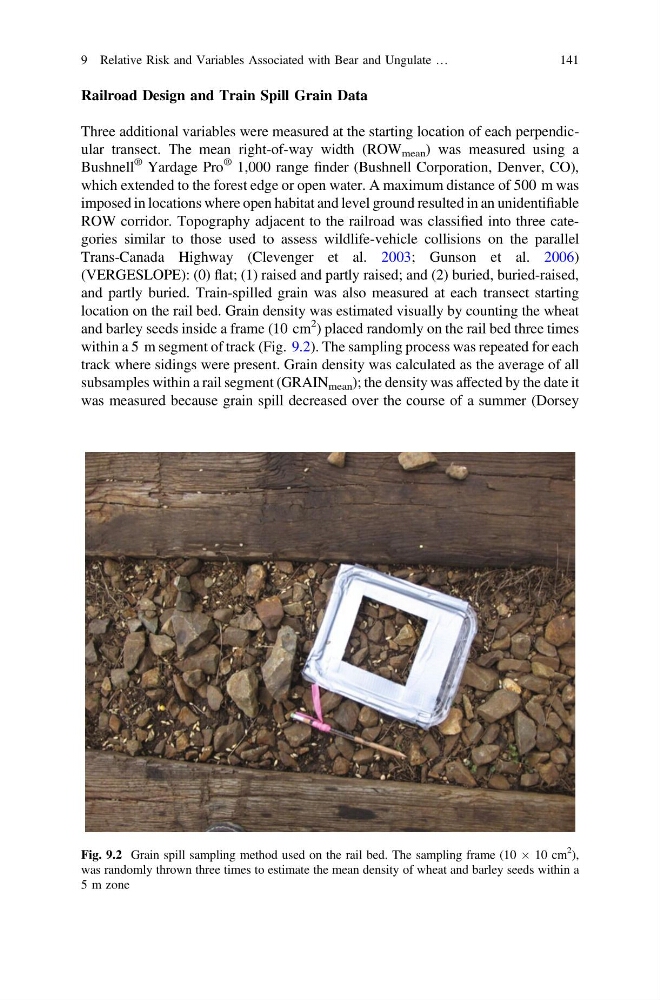
location on the rail bed. Grain density was estimated visually by counting the wheat
and barley seeds inside a frame (10 cm
2 ) placed randomly on the rail bed three times
within a 5 m segment of track (Fig. 9.2). The sampling process was repeated for each
track where sidings were present. Grain density was calculated as the average of all
subsamples within a rail segment (GRAIN mean ); the density was affected by the date it
was measured because grain spill decreased over the course of a summer (Dorsey
Fig. 9.2 Grain spill sampling method used on the rail bed. The sampling frame (10 Â 10 cm
2
),
was randomly thrown three times to estimate the mean density of wheat and barley seeds within a
5 m zone
9 Relative Risk and Variables Associated with Bear and Ungulate …
141
Three additional variables were measured at the starting location of each perpendicular transect. The mean right-of-way width (ROW mean ) was measured using a
Bushnell
® Yardage Pro
® 1,000 range finder (Bushnell Corporation, Denver, CO),
which extended to the forest edge or open water. A maximum distance of 500 m was
imposed in locations where open habitat and level ground resulted in an unidentifiable
ROW corridor. Topography adjacent to the railroad was classified into three categories similar to those used to assess wildlife-vehicle collisions on the parallel
Trans-Canada Highway (Clevenger et al. 2003; Gunson et al. 2006)
(VERGESLOPE): (0) flat; (1) raised and partly raised; and (2) buried, buried-raised,
and partly buried. Train-spilled grain was also measured at each transect starting
location on the rail bed. Grain density was estimated visually by counting the wheat
and barley seeds inside a frame (10 cm
2 ) placed randomly on the rail bed three times
within a 5 m segment of track (Fig. 9.2). The sampling process was repeated for each
track where sidings were present. Grain density was calculated as the average of all
subsamples within a rail segment (GRAIN mean ); the density was affected by the date it
was measured because grain spill decreased over the course of a summer (Dorsey
Fig. 9.2 Grain spill sampling method used on the rail bed. The sampling frame (10 Â 10 cm
2
),
was randomly thrown three times to estimate the mean density of wheat and barley seeds within a
5 m zone
9 Relative Risk and Variables Associated with Bear and Ungulate …
141