

using a GPS unit (Trimble Navigation Ltd., Sunnyvale, USA). Black and grizzly
bear scats were classified as “bear” because they could not be differentiated in the
field. When the diameter, age and contents were visibly similar for scats found
within 5 m, only one scat was recorded. All scats detected were removed from the
CPR to avoid double counting. Where multiple tracks were encountered, e.g.,
sidings, all tracks were surveyed and the mean number of scats detected per track
was used in the analysis.
Perpendicular transects were used to estimate relative abundance for bears and
ungulates within the railroad corridor (<250 m). Two random points were generated
within each rail segment in a GIS for each sampling year. Each point was used as
the starting location for a perpendicular transect. At each point, a transect extended
out perpendicularly away from the CPR in both directions for 250 m; the transects
were 3 m wide. Pellet groups and scat found more than 1.5 m from the transect
center were not recorded. Perpendicular transects were truncated at the edge of
impassable features such as rock cliffs, rivers and open water. Along each transect
ungulate pellet groups were classified into those of elk or deer based on differences
in size and shaped as described by Elbroch (2003). White-tailed deer and mule deer
pellets were combined into one class of “deer” because they could not be reliably
differentiated in the field. The number of pellet groups was counted for each
transect. Bear scats were recorded using the same criteria as the rail bed transects.
Pellets and scat that appeared to be more than a year old-based on visible signs of
decay (bleached color or unconsolidated) were excluded as were amorphous
ungulate or bear feces (Elbroch 2003).
The count of bear scats were weighted based on the date they were detected, as
they are detectable throughout the short summer season (Dorsey 2011). The first
day that bears have been historically sighted in the study area is April 15; although
the date of bears’ emergence varies each year, it was used as a starting date for
when bears could have been foraging on grain and left scats. As each day passed
after April 15, there were cumulatively more days when bears could have visited
and left scats. Therefore, each scat was given a weight inversely proportional to the
day of year it was detected after April 15, which is the 105th Julian calendar day of
the year. For example, the weighted value of one scat detected on September 13th,
(day 273 of the year) would be ((273–105)
−1 = 0.006). The final value was the sum
of all weighted scats detected for each track segment stored as RA rail bed .
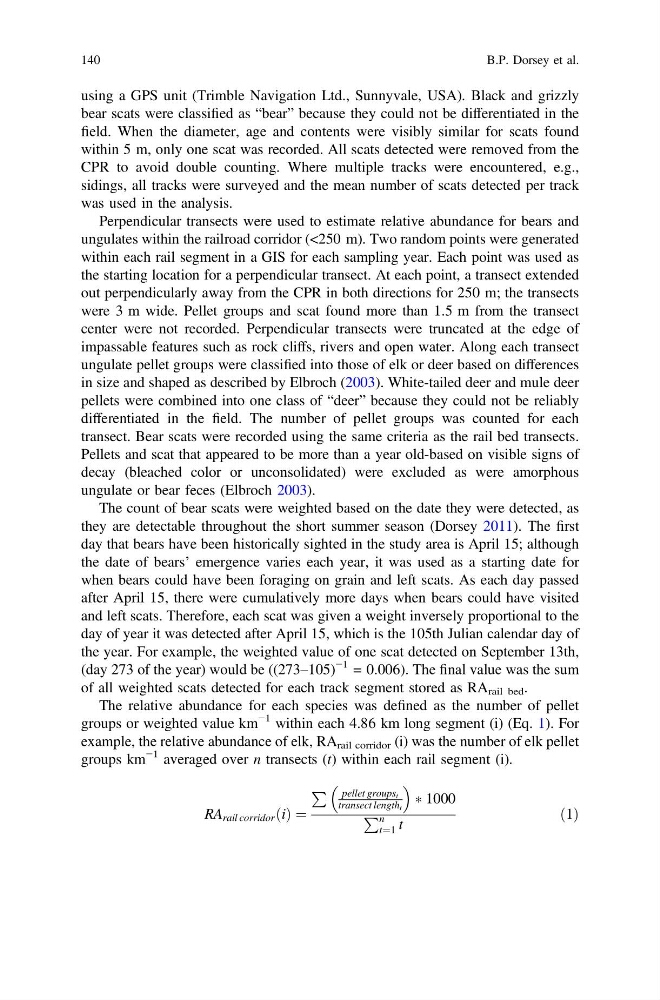
The relative abundance for each species was defined as the number of pellet
groups or weighted value km
−1 within each 4.86 km long segment (i) (Eq. 1). For
example, the relative abundance of elk, RA rail corridor (i) was the number of elk pellet
groups km
−1 averaged over n transects (t) within each rail segment (i).
RA rail corridor i
ð Þ ¼
P pellet groups t
transect length t
à 1000
P n
t¼1 t
ð1Þ
140
B.P. Dorsey et al.
bear scats were classified as “bear” because they could not be differentiated in the
field. When the diameter, age and contents were visibly similar for scats found
within 5 m, only one scat was recorded. All scats detected were removed from the
CPR to avoid double counting. Where multiple tracks were encountered, e.g.,
sidings, all tracks were surveyed and the mean number of scats detected per track
was used in the analysis.
Perpendicular transects were used to estimate relative abundance for bears and
ungulates within the railroad corridor (<250 m). Two random points were generated
within each rail segment in a GIS for each sampling year. Each point was used as
the starting location for a perpendicular transect. At each point, a transect extended
out perpendicularly away from the CPR in both directions for 250 m; the transects
were 3 m wide. Pellet groups and scat found more than 1.5 m from the transect
center were not recorded. Perpendicular transects were truncated at the edge of
impassable features such as rock cliffs, rivers and open water. Along each transect
ungulate pellet groups were classified into those of elk or deer based on differences
in size and shaped as described by Elbroch (2003). White-tailed deer and mule deer
pellets were combined into one class of “deer” because they could not be reliably
differentiated in the field. The number of pellet groups was counted for each
transect. Bear scats were recorded using the same criteria as the rail bed transects.
Pellets and scat that appeared to be more than a year old-based on visible signs of
decay (bleached color or unconsolidated) were excluded as were amorphous
ungulate or bear feces (Elbroch 2003).
The count of bear scats were weighted based on the date they were detected, as
they are detectable throughout the short summer season (Dorsey 2011). The first
day that bears have been historically sighted in the study area is April 15; although
the date of bears’ emergence varies each year, it was used as a starting date for
when bears could have been foraging on grain and left scats. As each day passed
after April 15, there were cumulatively more days when bears could have visited
and left scats. Therefore, each scat was given a weight inversely proportional to the
day of year it was detected after April 15, which is the 105th Julian calendar day of
the year. For example, the weighted value of one scat detected on September 13th,
(day 273 of the year) would be ((273–105)
−1 = 0.006). The final value was the sum
of all weighted scats detected for each track segment stored as RA rail bed .
The relative abundance for each species was defined as the number of pellet
groups or weighted value km
−1 within each 4.86 km long segment (i) (Eq. 1). For
example, the relative abundance of elk, RA rail corridor (i) was the number of elk pellet
groups km
−1 averaged over n transects (t) within each rail segment (i).
RA rail corridor i
ð Þ ¼
P pellet groups t
transect length t
à 1000
P n
t¼1 t
ð1Þ
140
B.P. Dorsey et al.