

and dwarf stars. As a result, Fujita found that molecular abundance was higher in
giant than in dwarf atmospheres (Fujita 1935).
Fujita also applied his calculations of the relative intensities of molecules to the
interpretation of spectral sequence in the Harvard classification (Appendix, Sect. 1).
This sequence is widely accepted as a steadily decreasing temperature sequence,
based on Saha’s ionization theory. In this theory, however, it is not clear why
spectral sequence separate into three branches at G type.
Fujita’s idea was to examine the variety of relative abundance of O, C, and N
from the relative intensities of molecular bands in stellar spectra. By comparing these
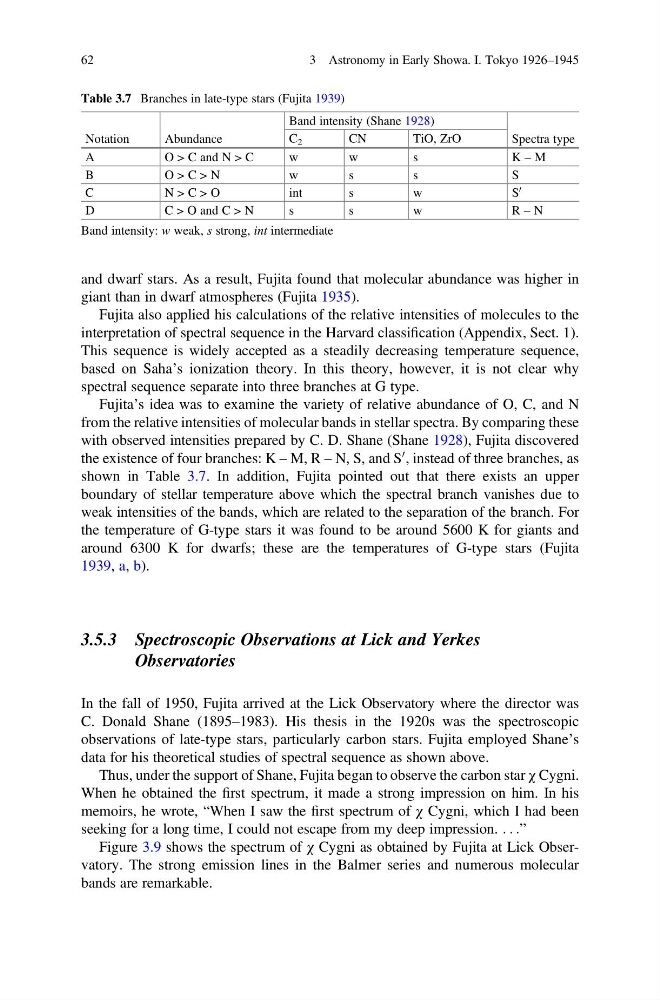
with observed intensities prepared by C. D. Shane (Shane 1928), Fujita discovered
the existence of four branches: K – M, R – N, S, and S
0 , instead of three branches, as
shown in Table 3.7. In addition, Fujita pointed out that there exists an upper
boundary of stellar temperature above which the spectral branch vanishes due to
weak intensities of the bands, which are related to the separation of the branch. For
the temperature of G-type stars it was found to be around 5600 K for giants and
around 6300 K for dwarfs; these are the temperatures of G-type stars (Fujita
1939, a, b).
3.5.3 Spectroscopic Observations at Lick and Yerkes
Observatories
In the fall of 1950, Fujita arrived at the Lick Observatory where the director was
C. Donald Shane (1895–1983). His thesis in the 1920s was the spectroscopic
observations of late-type stars, particularly carbon stars. Fujita employed Shane’s
data for his theoretical studies of spectral sequence as shown above.
Thus, under the support of Shane, Fujita began to observe the carbon star χ Cygni.
When he obtained the first spectrum, it made a strong impression on him. In his
memoirs, he wrote, “When I saw the first spectrum of χ Cygni, which I had been
seeking for a long time, I could not escape from my deep impression. . . .”
Figure 3.9 shows the spectrum of χ Cygni as obtained by Fujita at Lick Observatory. The strong emission lines in the Balmer series and numerous molecular
bands are remarkable.
Table 3.7 Branches in late-type stars (Fujita 1939)
Notation
Abundance
Band intensity (Shane 1928)
Spectra type
C 2
CN
TiO, ZrO
A
O > C and N > C
w
w
s
K – M
B
O > C > N
w
s
s
S
C
N > C > O
int
s
w
S
0
D
C > O and C > N
s
s
w
R – N
Band intensity: w weak, s strong, int intermediate
62
3 Astronomy in Early Showa. I. Tokyo 1926–1945
giant than in dwarf atmospheres (Fujita 1935).
Fujita also applied his calculations of the relative intensities of molecules to the
interpretation of spectral sequence in the Harvard classification (Appendix, Sect. 1).
This sequence is widely accepted as a steadily decreasing temperature sequence,
based on Saha’s ionization theory. In this theory, however, it is not clear why
spectral sequence separate into three branches at G type.
Fujita’s idea was to examine the variety of relative abundance of O, C, and N
from the relative intensities of molecular bands in stellar spectra. By comparing these
with observed intensities prepared by C. D. Shane (Shane 1928), Fujita discovered
the existence of four branches: K – M, R – N, S, and S
0 , instead of three branches, as
shown in Table 3.7. In addition, Fujita pointed out that there exists an upper
boundary of stellar temperature above which the spectral branch vanishes due to
weak intensities of the bands, which are related to the separation of the branch. For
the temperature of G-type stars it was found to be around 5600 K for giants and
around 6300 K for dwarfs; these are the temperatures of G-type stars (Fujita
1939, a, b).
3.5.3 Spectroscopic Observations at Lick and Yerkes
Observatories
In the fall of 1950, Fujita arrived at the Lick Observatory where the director was
C. Donald Shane (1895–1983). His thesis in the 1920s was the spectroscopic
observations of late-type stars, particularly carbon stars. Fujita employed Shane’s
data for his theoretical studies of spectral sequence as shown above.
Thus, under the support of Shane, Fujita began to observe the carbon star χ Cygni.
When he obtained the first spectrum, it made a strong impression on him. In his
memoirs, he wrote, “When I saw the first spectrum of χ Cygni, which I had been
seeking for a long time, I could not escape from my deep impression. . . .”
Figure 3.9 shows the spectrum of χ Cygni as obtained by Fujita at Lick Observatory. The strong emission lines in the Balmer series and numerous molecular
bands are remarkable.
Table 3.7 Branches in late-type stars (Fujita 1939)
Notation
Abundance
Band intensity (Shane 1928)
Spectra type
C 2
CN
TiO, ZrO
A
O > C and N > C
w
w
s
K – M
B
O > C > N
w
s
s
S
C
N > C > O
int
s
w
S
0
D
C > O and C > N
s
s
w
R – N
Band intensity: w weak, s strong, int intermediate
62
3 Astronomy in Early Showa. I. Tokyo 1926–1945