

Hatanaka’s first area was the analysis of forbidden lines of ionized oxygen (OII
and OIII) in planetary nebulae (Hatanaka 1942). He solved the radiative equations
related to two metastable states and derived the relative populations of OII and OIII,
N (OII)/N (OIII), as a function of stellar temperature Ts, and compared them with
observations for several planetary nebulae. The relative population gradually
decreases with increasing stellar temperature, in good agreement with observations.
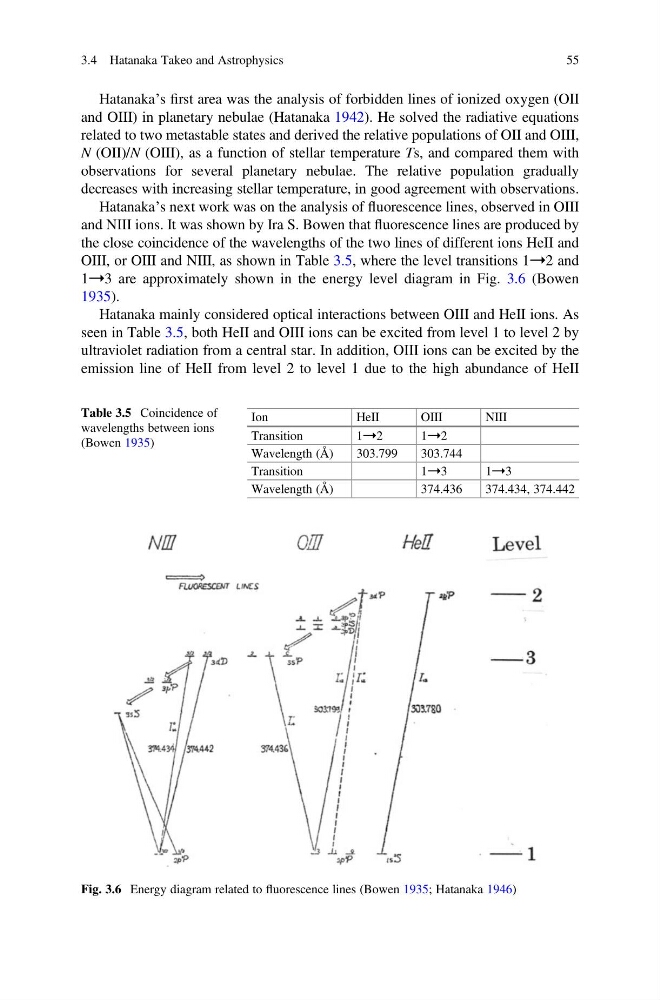
Hatanaka’s next work was on the analysis of fluorescence lines, observed in OIII
and NIII ions. It was shown by Ira S. Bowen that fluorescence lines are produced by
the close coincidence of the wavelengths of the two lines of different ions HeII and
OIII, or OIII and NIII, as shown in Table 3.5, where the level transitions 1➝2 and
1➝3 are approximately shown in the energy level diagram in Fig. 3.6 (Bowen
1935).
Hatanaka mainly considered optical interactions between OIII and HeII ions. As
seen in Table 3.5, both HeII and OIII ions can be excited from level 1 to level 2 by
ultraviolet radiation from a central star. In addition, OIII ions can be excited by the
emission line of HeII from level 2 to level 1 due to the high abundance of HeII
Table 3.5 Coincidence of
wavelengths between ions
(Bowen 1935)
Ion
HeII
OIII
NIII
Transition
1➝2
1 ➝2
Wavelength (Å)
303.799
303.744
Transition
1➝3
1 ➝3
Wavelength (Å)
374.436
374.434, 374.442
Fig. 3.6 Energy diagram related to fluorescence lines (Bowen 1935; Hatanaka 1946)
3.4 Hatanaka Takeo and Astrophysics
55
and OIII) in planetary nebulae (Hatanaka 1942). He solved the radiative equations
related to two metastable states and derived the relative populations of OII and OIII,
N (OII)/N (OIII), as a function of stellar temperature Ts, and compared them with
observations for several planetary nebulae. The relative population gradually
decreases with increasing stellar temperature, in good agreement with observations.
Hatanaka’s next work was on the analysis of fluorescence lines, observed in OIII
and NIII ions. It was shown by Ira S. Bowen that fluorescence lines are produced by
the close coincidence of the wavelengths of the two lines of different ions HeII and
OIII, or OIII and NIII, as shown in Table 3.5, where the level transitions 1➝2 and
1➝3 are approximately shown in the energy level diagram in Fig. 3.6 (Bowen
1935).
Hatanaka mainly considered optical interactions between OIII and HeII ions. As
seen in Table 3.5, both HeII and OIII ions can be excited from level 1 to level 2 by
ultraviolet radiation from a central star. In addition, OIII ions can be excited by the
emission line of HeII from level 2 to level 1 due to the high abundance of HeII
Table 3.5 Coincidence of
wavelengths between ions
(Bowen 1935)
Ion
HeII
OIII
NIII
Transition
1➝2
1 ➝2
Wavelength (Å)
303.799
303.744
Transition
1➝3
1 ➝3
Wavelength (Å)
374.436
374.434, 374.442
Fig. 3.6 Energy diagram related to fluorescence lines (Bowen 1935; Hatanaka 1946)
3.4 Hatanaka Takeo and Astrophysics
55