

log < π >¼ a þ bm þ c log μ
ð2:2Þ
where a, b, and c are constants to be determined from observation. Hirayama applied
this formula to stars of every spectral type separately and found that the mean
parallaxes of F, G, and K stars are larger (<π > 〜 0.05) than those of B, A, and
M stars (<π > 〜 0.02–0.01) (Hirayama 1922b). The reason for this difference,
although Hirayama offered no explanation, is made comprehensible by the fact that
nearby stars mostly belong to the late main-sequence stars, whereas B, A, and M
stars are distributed in a more distant region in the Galaxy. In addition, he compared
the mean parallax with trigonometric and spectroscopic parallaxes and claimed an
advantage for his mean parallax. Unfortunately for him, the role of the mean
parallax ended in the early 1920s, because spectroscopic and Cepheid parallaxes
became the main tools of distance measurements starting at that time.
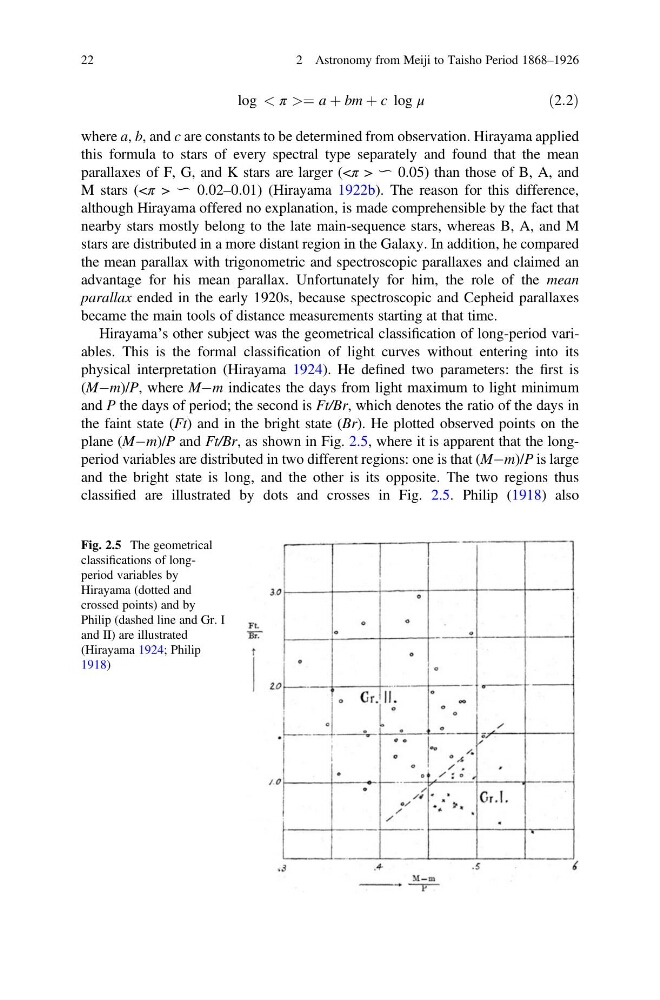
Hirayama’s other subject was the geometrical classification of long-period variables. This is the formal classification of light curves without entering into its
physical interpretation (Hirayama 1924). He defined two parameters: the first is
(MÀm)/P, where MÀm indicates the days from light maximum to light minimum
and P the days of period; the second is Ft/Br, which denotes the ratio of the days in
the faint state (Ft) and in the bright state (Br). He plotted observed points on the
plane (MÀm)/P and Ft/Br, as shown in Fig. 2.5, where it is apparent that the longperiod variables are distributed in two different regions: one is that (MÀm)/P is large
and the bright state is long, and the other is its opposite. The two regions thus
classified are illustrated by dots and crosses in Fig. 2.5. Philip (1918) also
Fig. 2.5 The geometrical
classifications of longperiod variables by
Hirayama (dotted and
crossed points) and by
Philip (dashed line and Gr. I
and II) are illustrated
(Hirayama 1924; Philip
1918)
22
2 Astronomy from Meiji to Taisho Period 1868–1926
ð2:2Þ
where a, b, and c are constants to be determined from observation. Hirayama applied
this formula to stars of every spectral type separately and found that the mean
parallaxes of F, G, and K stars are larger (<π > 〜 0.05) than those of B, A, and
M stars (<π > 〜 0.02–0.01) (Hirayama 1922b). The reason for this difference,
although Hirayama offered no explanation, is made comprehensible by the fact that
nearby stars mostly belong to the late main-sequence stars, whereas B, A, and M
stars are distributed in a more distant region in the Galaxy. In addition, he compared
the mean parallax with trigonometric and spectroscopic parallaxes and claimed an
advantage for his mean parallax. Unfortunately for him, the role of the mean
parallax ended in the early 1920s, because spectroscopic and Cepheid parallaxes
became the main tools of distance measurements starting at that time.
Hirayama’s other subject was the geometrical classification of long-period variables. This is the formal classification of light curves without entering into its
physical interpretation (Hirayama 1924). He defined two parameters: the first is
(MÀm)/P, where MÀm indicates the days from light maximum to light minimum
and P the days of period; the second is Ft/Br, which denotes the ratio of the days in
the faint state (Ft) and in the bright state (Br). He plotted observed points on the
plane (MÀm)/P and Ft/Br, as shown in Fig. 2.5, where it is apparent that the longperiod variables are distributed in two different regions: one is that (MÀm)/P is large
and the bright state is long, and the other is its opposite. The two regions thus
classified are illustrated by dots and crosses in Fig. 2.5. Philip (1918) also
Fig. 2.5 The geometrical
classifications of longperiod variables by
Hirayama (dotted and
crossed points) and by
Philip (dashed line and Gr. I
and II) are illustrated
(Hirayama 1924; Philip
1918)
22
2 Astronomy from Meiji to Taisho Period 1868–1926