

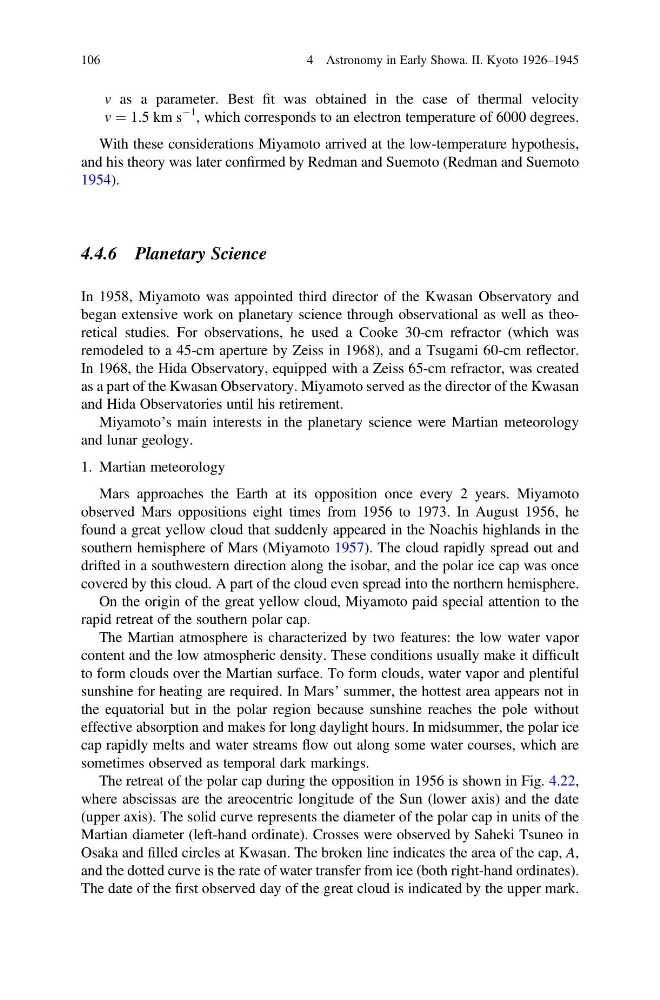
v as a parameter. Best fit was obtained in the case of thermal velocity
v ¼ 1.5 km s
À1 , which corresponds to an electron temperature of 6000 degrees.
With these considerations Miyamoto arrived at the low-temperature hypothesis,
and his theory was later confirmed by Redman and Suemoto (Redman and Suemoto
1954).
4.4.6 Planetary Science
In 1958, Miyamoto was appointed third director of the Kwasan Observatory and
began extensive work on planetary science through observational as well as theoretical studies. For observations, he used a Cooke 30-cm refractor (which was
remodeled to a 45-cm aperture by Zeiss in 1968), and a Tsugami 60-cm reflector.
In 1968, the Hida Observatory, equipped with a Zeiss 65-cm refractor, was created
as a part of the Kwasan Observatory. Miyamoto served as the director of the Kwasan
and Hida Observatories until his retirement.
Miyamoto’s main interests in the planetary science were Martian meteorology
and lunar geology.
1. Martian meteorology
Mars approaches the Earth at its opposition once every 2 years. Miyamoto
observed Mars oppositions eight times from 1956 to 1973. In August 1956, he
found a great yellow cloud that suddenly appeared in the Noachis highlands in the
southern hemisphere of Mars (Miyamoto 1957). The cloud rapidly spread out and
drifted in a southwestern direction along the isobar, and the polar ice cap was once
covered by this cloud. A part of the cloud even spread into the northern hemisphere.
On the origin of the great yellow cloud, Miyamoto paid special attention to the
rapid retreat of the southern polar cap.
The Martian atmosphere is characterized by two features: the low water vapor
content and the low atmospheric density. These conditions usually make it difficult
to form clouds over the Martian surface. To form clouds, water vapor and plentiful
sunshine for heating are required. In Mars’ summer, the hottest area appears not in
the equatorial but in the polar region because sunshine reaches the pole without
effective absorption and makes for long daylight hours. In midsummer, the polar ice
cap rapidly melts and water streams flow out along some water courses, which are
sometimes observed as temporal dark markings.
The retreat of the polar cap during the opposition in 1956 is shown in Fig. 4.22,
where abscissas are the areocentric longitude of the Sun (lower axis) and the date
(upper axis). The solid curve represents the diameter of the polar cap in units of the
Martian diameter (left-hand ordinate). Crosses were observed by Saheki Tsuneo in
Osaka and filled circles at Kwasan. The broken line indicates the area of the cap, A,
and the dotted curve is the rate of water transfer from ice (both right-hand ordinates).
The date of the first observed day of the great cloud is indicated by the upper mark.
106
4 Astronomy in Early Showa. II. Kyoto 1926–1945
v ¼ 1.5 km s
À1 , which corresponds to an electron temperature of 6000 degrees.
With these considerations Miyamoto arrived at the low-temperature hypothesis,
and his theory was later confirmed by Redman and Suemoto (Redman and Suemoto
1954).
4.4.6 Planetary Science
In 1958, Miyamoto was appointed third director of the Kwasan Observatory and
began extensive work on planetary science through observational as well as theoretical studies. For observations, he used a Cooke 30-cm refractor (which was
remodeled to a 45-cm aperture by Zeiss in 1968), and a Tsugami 60-cm reflector.
In 1968, the Hida Observatory, equipped with a Zeiss 65-cm refractor, was created
as a part of the Kwasan Observatory. Miyamoto served as the director of the Kwasan
and Hida Observatories until his retirement.
Miyamoto’s main interests in the planetary science were Martian meteorology
and lunar geology.
1. Martian meteorology
Mars approaches the Earth at its opposition once every 2 years. Miyamoto
observed Mars oppositions eight times from 1956 to 1973. In August 1956, he
found a great yellow cloud that suddenly appeared in the Noachis highlands in the
southern hemisphere of Mars (Miyamoto 1957). The cloud rapidly spread out and
drifted in a southwestern direction along the isobar, and the polar ice cap was once
covered by this cloud. A part of the cloud even spread into the northern hemisphere.
On the origin of the great yellow cloud, Miyamoto paid special attention to the
rapid retreat of the southern polar cap.
The Martian atmosphere is characterized by two features: the low water vapor
content and the low atmospheric density. These conditions usually make it difficult
to form clouds over the Martian surface. To form clouds, water vapor and plentiful
sunshine for heating are required. In Mars’ summer, the hottest area appears not in
the equatorial but in the polar region because sunshine reaches the pole without
effective absorption and makes for long daylight hours. In midsummer, the polar ice
cap rapidly melts and water streams flow out along some water courses, which are
sometimes observed as temporal dark markings.
The retreat of the polar cap during the opposition in 1956 is shown in Fig. 4.22,
where abscissas are the areocentric longitude of the Sun (lower axis) and the date
(upper axis). The solid curve represents the diameter of the polar cap in units of the
Martian diameter (left-hand ordinate). Crosses were observed by Saheki Tsuneo in
Osaka and filled circles at Kwasan. The broken line indicates the area of the cap, A,
and the dotted curve is the rate of water transfer from ice (both right-hand ordinates).
The date of the first observed day of the great cloud is indicated by the upper mark.
106
4 Astronomy in Early Showa. II. Kyoto 1926–1945