

bio-based materials [17]. Since use and EoL phases are not considered in this study,
it is important to mention that the benefits of accounting for biogenic carbon storage
during plant growing is generally counter-balanced with the release of biogenic
carbon during use and/or EoL phases. In the results presented here, biogenic carbon
storage was accounted for but its release during use and/or EoL not. The relative
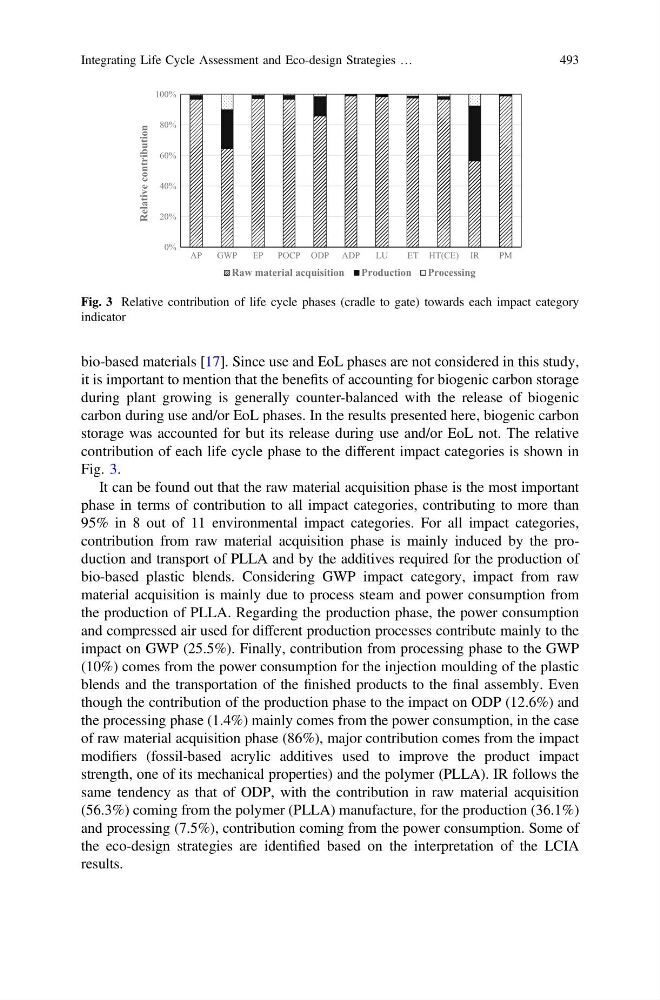
contribution of each life cycle phase to the different impact categories is shown in
Fig. 3.
It can be found out that the raw material acquisition phase is the most important
phase in terms of contribution to all impact categories, contributing to more than
95% in 8 out of 11 environmental impact categories. For all impact categories,
contribution from raw material acquisition phase is mainly induced by the production and transport of PLLA and by the additives required for the production of
bio-based plastic blends. Considering GWP impact category, impact from raw
material acquisition is mainly due to process steam and power consumption from
the production of PLLA. Regarding the production phase, the power consumption
and compressed air used for different production processes contribute mainly to the
impact on GWP (25.5%). Finally, contribution from processing phase to the GWP
(10%) comes from the power consumption for the injection moulding of the plastic
blends and the transportation of the finished products to the final assembly. Even
though the contribution of the production phase to the impact on ODP (12.6%) and
the processing phase (1.4%) mainly comes from the power consumption, in the case
of raw material acquisition phase (86%), major contribution comes from the impact
modifiers (fossil-based acrylic additives used to improve the product impact
strength, one of its mechanical properties) and the polymer (PLLA). IR follows the
same tendency as that of ODP, with the contribution in raw material acquisition
(56.3%) coming from the polymer (PLLA) manufacture, for the production (36.1%)
and processing (7.5%), contribution coming from the power consumption. Some of
the eco-design strategies are identified based on the interpretation of the LCIA
results.
0%
20%
40%
60%
80%
100%
AP
GWP
EP
POCP ODP ADP
LU
ET HT(CE) IR
PM
Relative contribution
Raw material acquisition
Production
Processing
Fig. 3 Relative contribution of life cycle phases (cradle to gate) towards each impact category
indicator
Integrating Life Cycle Assessment and Eco-design Strategies …
493
it is important to mention that the benefits of accounting for biogenic carbon storage
during plant growing is generally counter-balanced with the release of biogenic
carbon during use and/or EoL phases. In the results presented here, biogenic carbon
storage was accounted for but its release during use and/or EoL not. The relative
contribution of each life cycle phase to the different impact categories is shown in
Fig. 3.
It can be found out that the raw material acquisition phase is the most important
phase in terms of contribution to all impact categories, contributing to more than
95% in 8 out of 11 environmental impact categories. For all impact categories,
contribution from raw material acquisition phase is mainly induced by the production and transport of PLLA and by the additives required for the production of
bio-based plastic blends. Considering GWP impact category, impact from raw
material acquisition is mainly due to process steam and power consumption from
the production of PLLA. Regarding the production phase, the power consumption
and compressed air used for different production processes contribute mainly to the
impact on GWP (25.5%). Finally, contribution from processing phase to the GWP
(10%) comes from the power consumption for the injection moulding of the plastic
blends and the transportation of the finished products to the final assembly. Even
though the contribution of the production phase to the impact on ODP (12.6%) and
the processing phase (1.4%) mainly comes from the power consumption, in the case
of raw material acquisition phase (86%), major contribution comes from the impact
modifiers (fossil-based acrylic additives used to improve the product impact
strength, one of its mechanical properties) and the polymer (PLLA). IR follows the
same tendency as that of ODP, with the contribution in raw material acquisition
(56.3%) coming from the polymer (PLLA) manufacture, for the production (36.1%)
and processing (7.5%), contribution coming from the power consumption. Some of
the eco-design strategies are identified based on the interpretation of the LCIA
results.
0%
20%
40%
60%
80%
100%
AP
GWP
EP
POCP ODP ADP
LU
ET HT(CE) IR
PM
Relative contribution
Raw material acquisition
Production
Processing
Fig. 3 Relative contribution of life cycle phases (cradle to gate) towards each impact category
indicator
Integrating Life Cycle Assessment and Eco-design Strategies …
493