

In this case, the methodological sheets were taken as a basis to perform the social
assessment of the H. pluvialis astaxanthin production. Thus, a specific questionnaire
was developed, dealing with key issues and possible indicators related to the
sub-categories that were relevant for the scope of the assessment. The questionnaire
was fulfilled by two small and medium enterprises (SMEs) located in France and
Ireland. For confidentiality reasons, the companies are referred to as SME 1 and
SME 2 in the results section.
Three stakeholder groups were considered as the most representative in the
specific context of the study: workers, consumers and society. For each of them, the
selected indicators were grouped into sub-categories and measured in quantitative
or semi-quantitative terms. Indicators for workers included annual salary,
women-to-man ratio considering the total number of employees of each SME,
women-to-man salary difference for the country and working hours per week. For
consumers, impacts and benefits of the product were measured in terms of tests and
safety information provided, customer service and information on formulation and
use, value added of the product, natural origin, etc. Indicators for the society
included the relative importance of blue biotechnology in the country, potential
market share for the studied companies, compliance with certifications, existence of
signed codes of conduct on sustainability, etc.
Following the approach of previous social LCA works [21], each indicator was
expressed according to a numeric index based on the risk level in order to better
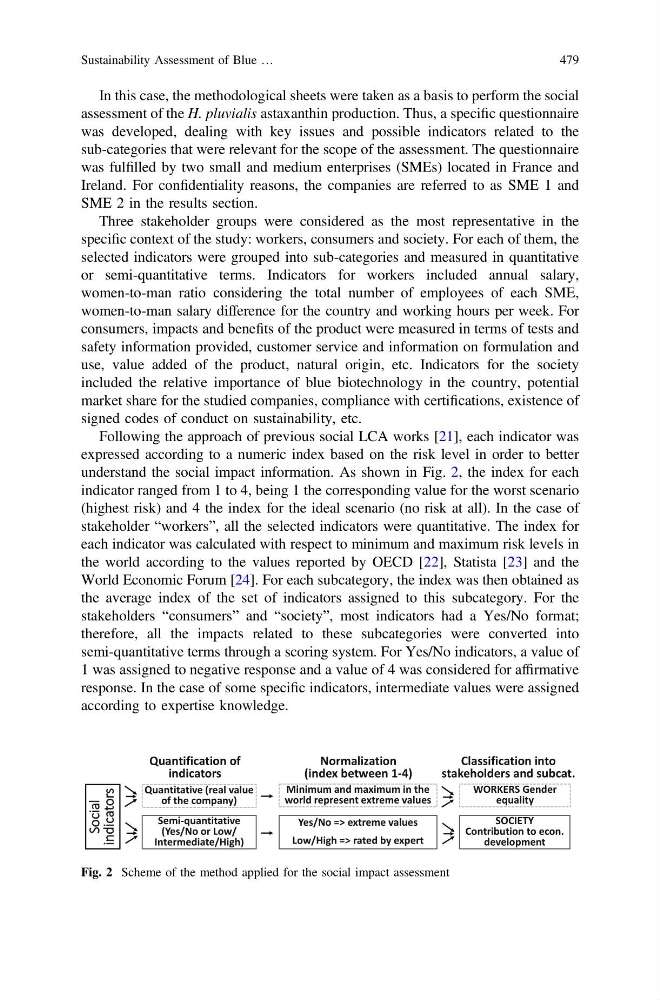
understand the social impact information. As shown in Fig. 2, the index for each
indicator ranged from 1 to 4, being 1 the corresponding value for the worst scenario
(highest risk) and 4 the index for the ideal scenario (no risk at all). In the case of
stakeholder “workers”, all the selected indicators were quantitative. The index for
each indicator was calculated with respect to minimum and maximum risk levels in
the world according to the values reported by OECD [22], Statista [23] and the
World Economic Forum [24]. For each subcategory, the index was then obtained as
the average index of the set of indicators assigned to this subcategory. For the
stakeholders “consumers” and “society”, most indicators had a Yes/No format;
therefore, all the impacts related to these subcategories were converted into
semi-quantitative terms through a scoring system. For Yes/No indicators, a value of
1 was assigned to negative response and a value of 4 was considered for affirmative
response. In the case of some specific indicators, intermediate values were assigned
according to expertise knowledge.
Social
indicators
Quantitative (real value
of the company)
SOCIETY
Contribution to econ.
development
WORKERS Gender
equality
Quantification of
indicators
Normalization
(index between 1-4)
Classification into
stakeholders and subcat.
Semi-quantitative
(Yes/No or Low/
Intermediate/High)
Minimum and maximum in the
world represent extreme values
Yes/No => extreme values
Low/High => rated by expert
Fig. 2 Scheme of the method applied for the social impact assessment
Sustainability Assessment of Blue …
479
assessment of the H. pluvialis astaxanthin production. Thus, a specific questionnaire
was developed, dealing with key issues and possible indicators related to the
sub-categories that were relevant for the scope of the assessment. The questionnaire
was fulfilled by two small and medium enterprises (SMEs) located in France and
Ireland. For confidentiality reasons, the companies are referred to as SME 1 and
SME 2 in the results section.
Three stakeholder groups were considered as the most representative in the
specific context of the study: workers, consumers and society. For each of them, the
selected indicators were grouped into sub-categories and measured in quantitative
or semi-quantitative terms. Indicators for workers included annual salary,
women-to-man ratio considering the total number of employees of each SME,
women-to-man salary difference for the country and working hours per week. For
consumers, impacts and benefits of the product were measured in terms of tests and
safety information provided, customer service and information on formulation and
use, value added of the product, natural origin, etc. Indicators for the society
included the relative importance of blue biotechnology in the country, potential
market share for the studied companies, compliance with certifications, existence of
signed codes of conduct on sustainability, etc.
Following the approach of previous social LCA works [21], each indicator was
expressed according to a numeric index based on the risk level in order to better
understand the social impact information. As shown in Fig. 2, the index for each
indicator ranged from 1 to 4, being 1 the corresponding value for the worst scenario
(highest risk) and 4 the index for the ideal scenario (no risk at all). In the case of
stakeholder “workers”, all the selected indicators were quantitative. The index for
each indicator was calculated with respect to minimum and maximum risk levels in
the world according to the values reported by OECD [22], Statista [23] and the
World Economic Forum [24]. For each subcategory, the index was then obtained as
the average index of the set of indicators assigned to this subcategory. For the
stakeholders “consumers” and “society”, most indicators had a Yes/No format;
therefore, all the impacts related to these subcategories were converted into
semi-quantitative terms through a scoring system. For Yes/No indicators, a value of
1 was assigned to negative response and a value of 4 was considered for affirmative
response. In the case of some specific indicators, intermediate values were assigned
according to expertise knowledge.
Social
indicators
Quantitative (real value
of the company)
SOCIETY
Contribution to econ.
development
WORKERS Gender
equality
Quantification of
indicators
Normalization
(index between 1-4)
Classification into
stakeholders and subcat.
Semi-quantitative
(Yes/No or Low/
Intermediate/High)
Minimum and maximum in the
world represent extreme values
Yes/No => extreme values
Low/High => rated by expert
Fig. 2 Scheme of the method applied for the social impact assessment
Sustainability Assessment of Blue …
479