

deduced from the fraction of mass of a product being collected to go to a
recycling process (C R ) and to reuse (C U ).
• The waste fraction from upstream process (w F ) derived from the efficiency of
the recycling process used to produce recycled feedstock for a product (E F );
• The waste fraction from downstream process (w C ) derived from the fraction of
mass of a product being collected to go to a recycling process (C R ) and the
efficiency of the recycling process used for the portion of a product collected for
recycling (E C );
LFI ¼
v þ w
2 þ w F Àw C
2
ð3Þ
v ¼ 1 À F R À F U
ð4Þ
w F ¼ F R
1 À E F
ð
Þ
E F
ð5Þ
w C ¼ C R 1 À E C
ð
Þ
ð6Þ
w ¼ w 0 þ
w C þ w F
2
ð7Þ
w 0 ¼ 1 À C R À C U
ð8Þ
X yields the multiplication of 2 ratios where the user is free to choose the one
that better represents the product duration reality. In one case the lifetime (L) of the
assessed product is compared to the average product lifetime in the industry (L av )
and in another case, the number of functional units (U)—as per in LCA—is
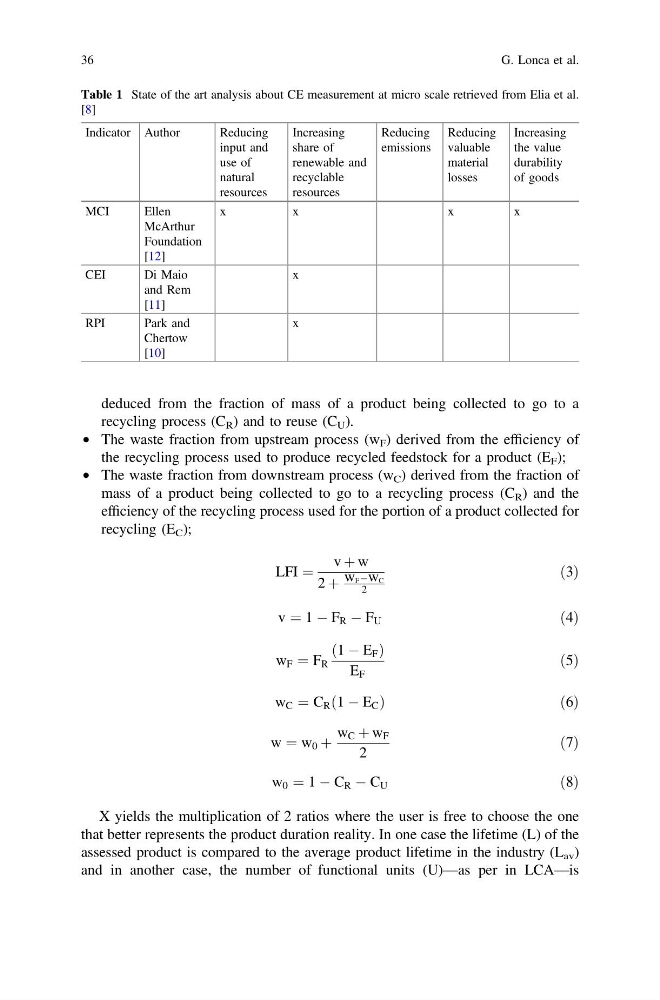
Table 1 State of the art analysis about CE measurement at micro scale retrieved from Elia et al.
[8]
Indicator Author
Reducing
input and
use of
natural
resources
Increasing
share of
renewable and
recyclable
resources
Reducing
emissions
Reducing
valuable
material
losses
Increasing
the value
durability
of goods
MCI
Ellen
McArthur
Foundation
[12]
x
x
x
x
CEI
Di Maio
and Rem
[11]
x
RPI
Park and
Chertow
[10]
x
36
G. Lonca et al.
recycling process (C R ) and to reuse (C U ).
• The waste fraction from upstream process (w F ) derived from the efficiency of
the recycling process used to produce recycled feedstock for a product (E F );
• The waste fraction from downstream process (w C ) derived from the fraction of
mass of a product being collected to go to a recycling process (C R ) and the
efficiency of the recycling process used for the portion of a product collected for
recycling (E C );
LFI ¼
v þ w
2 þ w F Àw C
2
ð3Þ
v ¼ 1 À F R À F U
ð4Þ
w F ¼ F R
1 À E F
ð
Þ
E F
ð5Þ
w C ¼ C R 1 À E C
ð
Þ
ð6Þ
w ¼ w 0 þ
w C þ w F
2
ð7Þ
w 0 ¼ 1 À C R À C U
ð8Þ
X yields the multiplication of 2 ratios where the user is free to choose the one
that better represents the product duration reality. In one case the lifetime (L) of the
assessed product is compared to the average product lifetime in the industry (L av )
and in another case, the number of functional units (U)—as per in LCA—is
Table 1 State of the art analysis about CE measurement at micro scale retrieved from Elia et al.
[8]
Indicator Author
Reducing
input and
use of
natural
resources
Increasing
share of
renewable and
recyclable
resources
Reducing
emissions
Reducing
valuable
material
losses
Increasing
the value
durability
of goods
MCI
Ellen
McArthur
Foundation
[12]
x
x
x
x
CEI
Di Maio
and Rem
[11]
x
RPI
Park and
Chertow
[10]
x
36
G. Lonca et al.