

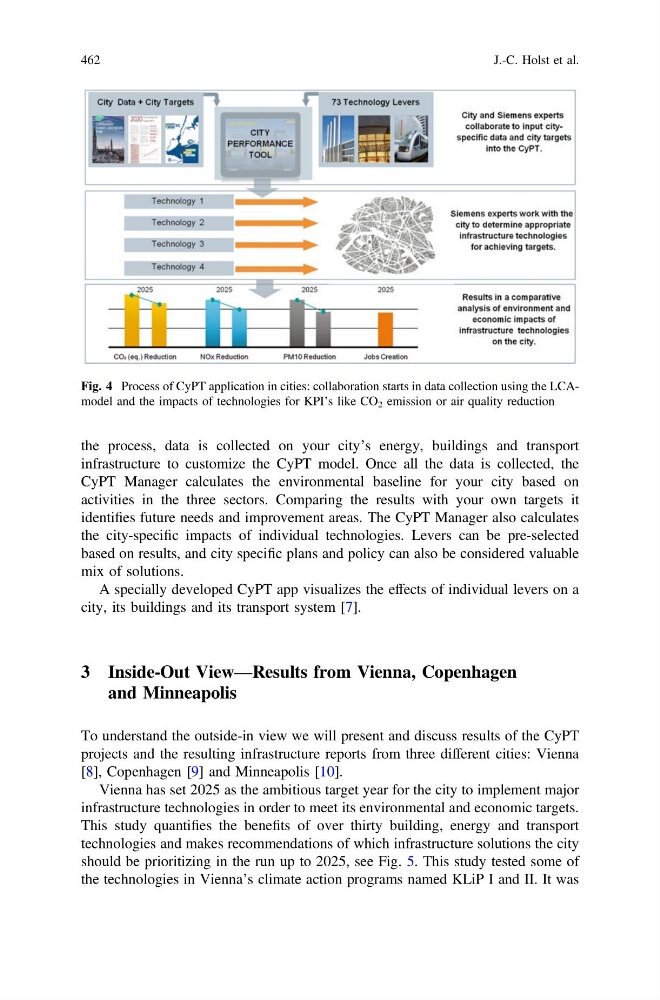
the process, data is collected on your city’s energy, buildings and transport
infrastructure to customize the CyPT model. Once all the data is collected, the
CyPT Manager calculates the environmental baseline for your city based on
activities in the three sectors. Comparing the results with your own targets it
identifies future needs and improvement areas. The CyPT Manager also calculates
the city-specific impacts of individual technologies. Levers can be pre-selected
based on results, and city specific plans and policy can also be considered valuable
mix of solutions.
A specially developed CyPT app visualizes the effects of individual levers on a
city, its buildings and its transport system [7].
3 Inside-Out View—Results from Vienna, Copenhagen
and Minneapolis
To understand the outside-in view we will present and discuss results of the CyPT
projects and the resulting infrastructure reports from three different cities: Vienna
[8], Copenhagen [9] and Minneapolis [10].
Vienna has set 2025 as the ambitious target year for the city to implement major
infrastructure technologies in order to meet its environmental and economic targets.
This study quantifies the benefits of over thirty building, energy and transport
technologies and makes recommendations of which infrastructure solutions the city
should be prioritizing in the run up to 2025, see Fig. 5. This study tested some of
the technologies in Vienna’s climate action programs named KLiP I and II. It was
Fig. 4 Process of CyPT application in cities: collaboration starts in data collection using the LCAmodel and the impacts of technologies for KPI’s like CO 2 emission or air quality reduction
462
J.-C. Holst et al.
infrastructure to customize the CyPT model. Once all the data is collected, the
CyPT Manager calculates the environmental baseline for your city based on
activities in the three sectors. Comparing the results with your own targets it
identifies future needs and improvement areas. The CyPT Manager also calculates
the city-specific impacts of individual technologies. Levers can be pre-selected
based on results, and city specific plans and policy can also be considered valuable
mix of solutions.
A specially developed CyPT app visualizes the effects of individual levers on a
city, its buildings and its transport system [7].
3 Inside-Out View—Results from Vienna, Copenhagen
and Minneapolis
To understand the outside-in view we will present and discuss results of the CyPT
projects and the resulting infrastructure reports from three different cities: Vienna
[8], Copenhagen [9] and Minneapolis [10].
Vienna has set 2025 as the ambitious target year for the city to implement major
infrastructure technologies in order to meet its environmental and economic targets.
This study quantifies the benefits of over thirty building, energy and transport
technologies and makes recommendations of which infrastructure solutions the city
should be prioritizing in the run up to 2025, see Fig. 5. This study tested some of
the technologies in Vienna’s climate action programs named KLiP I and II. It was
Fig. 4 Process of CyPT application in cities: collaboration starts in data collection using the LCAmodel and the impacts of technologies for KPI’s like CO 2 emission or air quality reduction
462
J.-C. Holst et al.