

buildings; passenger and freight transport demand; and the transport network. The
model baseline of the of a City’s lever network includes more than 2000 single
processes, and more than 1000 customized parameters. This baseline has three KPIs
—PM10 and NO x (air quality) and CO 2 eq. emissions—which are also projected
into the future based on a business-as-usual scenario and your own city’s demand
projection (if available). This calculation delivers a basic understanding of the root
causes of emissions in your city’s buildings and transport. A range of impacts can
be studied based on a single lever and its implementation rates, comparing options,
or combining several levers in one or more sectors [6].
Then mitigation strategies are applied in terms of what-if scenarios, by
answering the following questions: Which and how much energy is required to
serve the city’s demand in transport and buildings? Which infrastructure technologies are available, what is the efficiency of, how can the demand shifted or
reduced?
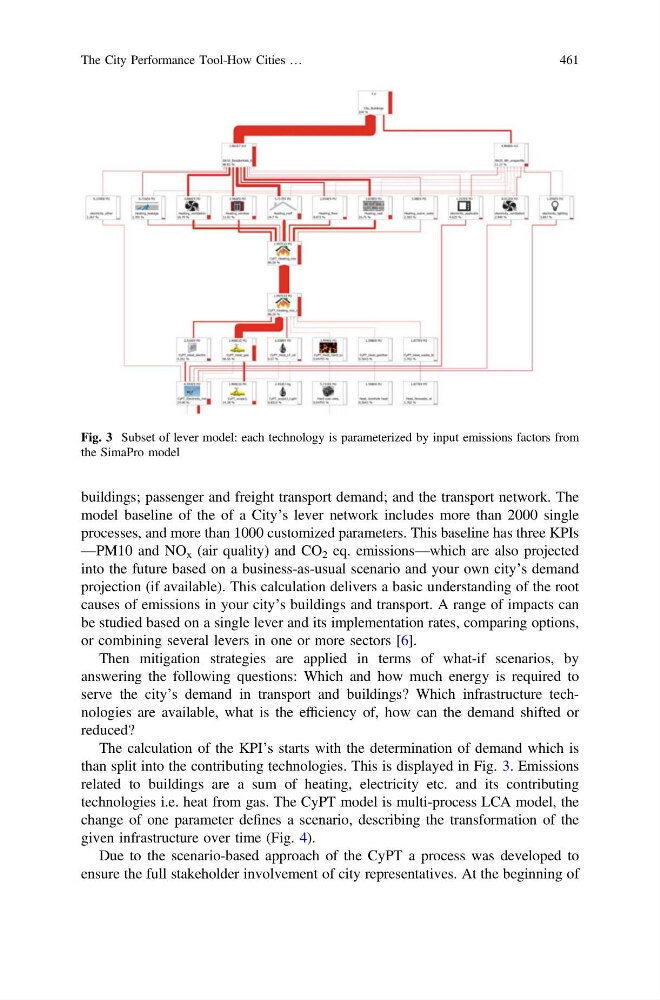
The calculation of the KPI’s starts with the determination of demand which is
than split into the contributing technologies. This is displayed in Fig. 3. Emissions
related to buildings are a sum of heating, electricity etc. and its contributing
technologies i.e. heat from gas. The CyPT model is multi-process LCA model, the
change of one parameter defines a scenario, describing the transformation of the
given infrastructure over time (Fig. 4).
Due to the scenario-based approach of the CyPT a process was developed to
ensure the full stakeholder involvement of city representatives. At the beginning of
Fig. 3 Subset of lever model: each technology is parameterized by input emissions factors from
the SimaPro model
The City Performance Tool-How Cities …
461
model baseline of the of a City’s lever network includes more than 2000 single
processes, and more than 1000 customized parameters. This baseline has three KPIs
—PM10 and NO x (air quality) and CO 2 eq. emissions—which are also projected
into the future based on a business-as-usual scenario and your own city’s demand
projection (if available). This calculation delivers a basic understanding of the root
causes of emissions in your city’s buildings and transport. A range of impacts can
be studied based on a single lever and its implementation rates, comparing options,
or combining several levers in one or more sectors [6].
Then mitigation strategies are applied in terms of what-if scenarios, by
answering the following questions: Which and how much energy is required to
serve the city’s demand in transport and buildings? Which infrastructure technologies are available, what is the efficiency of, how can the demand shifted or
reduced?
The calculation of the KPI’s starts with the determination of demand which is
than split into the contributing technologies. This is displayed in Fig. 3. Emissions
related to buildings are a sum of heating, electricity etc. and its contributing
technologies i.e. heat from gas. The CyPT model is multi-process LCA model, the
change of one parameter defines a scenario, describing the transformation of the
given infrastructure over time (Fig. 4).
Due to the scenario-based approach of the CyPT a process was developed to
ensure the full stakeholder involvement of city representatives. At the beginning of
Fig. 3 Subset of lever model: each technology is parameterized by input emissions factors from
the SimaPro model
The City Performance Tool-How Cities …
461