

3 Gaps in Decent Living
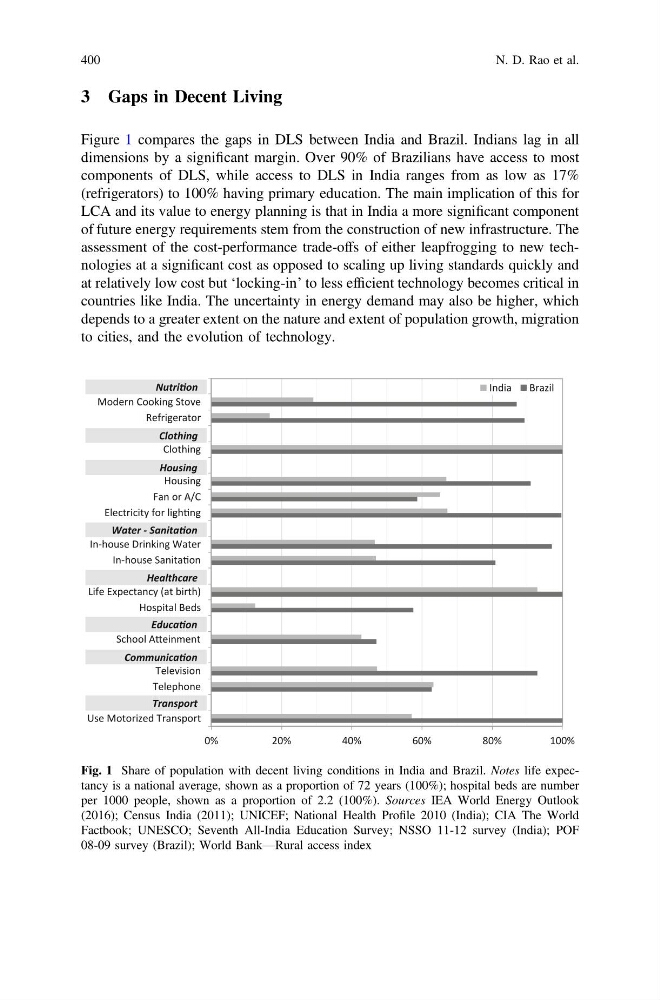
Figure 1 compares the gaps in DLS between India and Brazil. Indians lag in all
dimensions by a significant margin. Over 90% of Brazilians have access to most
components of DLS, while access to DLS in India ranges from as low as 17%
(refrigerators) to 100% having primary education. The main implication of this for
LCA and its value to energy planning is that in India a more significant component
of future energy requirements stem from the construction of new infrastructure. The
assessment of the cost-performance trade-offs of either leapfrogging to new technologies at a significant cost as opposed to scaling up living standards quickly and
at relatively low cost but ‘locking-in’ to less efficient technology becomes critical in
countries like India. The uncertainty in energy demand may also be higher, which
depends to a greater extent on the nature and extent of population growth, migration
to cities, and the evolution of technology.
0%
20%
40%
60%
80%
100%
Modern Cooking Stove
Refrigerator
Clothing
Housing
Fan or A/C
Electricity for lighƟng
In-house Drinking Water
In-house SanitaƟon
Life Expectancy (at birth)
Hospital Beds
School AƩeinment
Television
Telephone
Use Motorized Transport
India
Brazil
NutriƟon
Clothing
Housing
Water - SanitaƟon
Healthcare
EducaƟon
CommunicaƟon
Transport
Fig. 1 Share of population with decent living conditions in India and Brazil. Notes life expectancy is a national average, shown as a proportion of 72 years (100%); hospital beds are number
per 1000 people, shown as a proportion of 2.2 (100%). Sources IEA World Energy Outlook
(2016); Census India (2011); UNICEF; National Health Profile 2010 (India); CIA The World
Factbook; UNESCO; Seventh All-India Education Survey; NSSO 11-12 survey (India); POF
08-09 survey (Brazil); World Bank—Rural access index
400
N. D. Rao et al.
Figure 1 compares the gaps in DLS between India and Brazil. Indians lag in all
dimensions by a significant margin. Over 90% of Brazilians have access to most
components of DLS, while access to DLS in India ranges from as low as 17%
(refrigerators) to 100% having primary education. The main implication of this for
LCA and its value to energy planning is that in India a more significant component
of future energy requirements stem from the construction of new infrastructure. The
assessment of the cost-performance trade-offs of either leapfrogging to new technologies at a significant cost as opposed to scaling up living standards quickly and
at relatively low cost but ‘locking-in’ to less efficient technology becomes critical in
countries like India. The uncertainty in energy demand may also be higher, which
depends to a greater extent on the nature and extent of population growth, migration
to cities, and the evolution of technology.
0%
20%
40%
60%
80%
100%
Modern Cooking Stove
Refrigerator
Clothing
Housing
Fan or A/C
Electricity for lighƟng
In-house Drinking Water
In-house SanitaƟon
Life Expectancy (at birth)
Hospital Beds
School AƩeinment
Television
Telephone
Use Motorized Transport
India
Brazil
NutriƟon
Clothing
Housing
Water - SanitaƟon
Healthcare
EducaƟon
CommunicaƟon
Transport
Fig. 1 Share of population with decent living conditions in India and Brazil. Notes life expectancy is a national average, shown as a proportion of 72 years (100%); hospital beds are number
per 1000 people, shown as a proportion of 2.2 (100%). Sources IEA World Energy Outlook
(2016); Census India (2011); UNICEF; National Health Profile 2010 (India); CIA The World
Factbook; UNESCO; Seventh All-India Education Survey; NSSO 11-12 survey (India); POF
08-09 survey (Brazil); World Bank—Rural access index
400
N. D. Rao et al.