

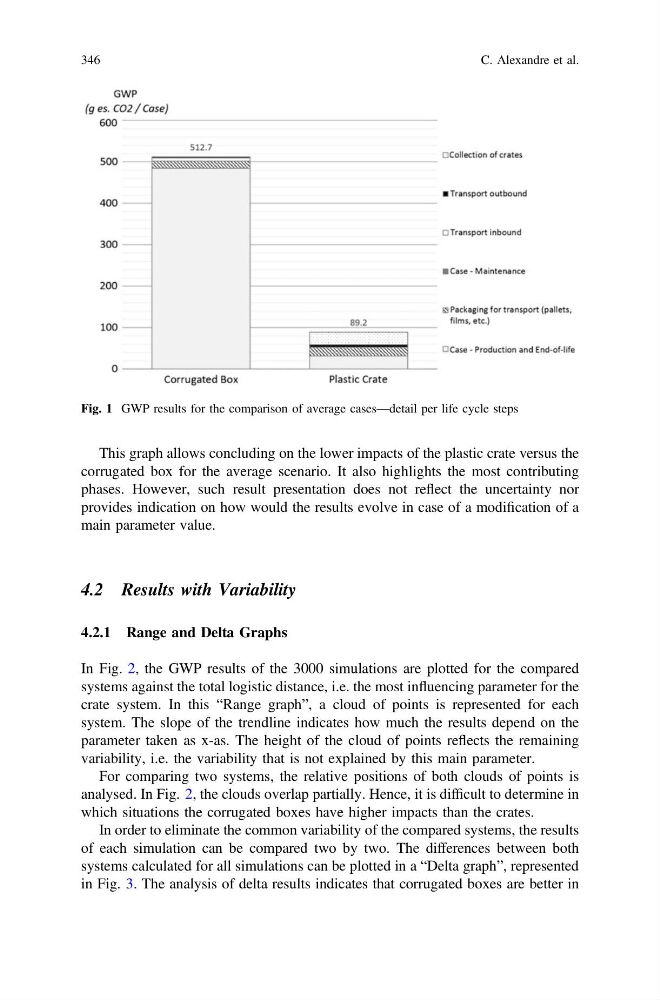
This graph allows concluding on the lower impacts of the plastic crate versus the
corrugated box for the average scenario. It also highlights the most contributing
phases. However, such result presentation does not reflect the uncertainty nor
provides indication on how would the results evolve in case of a modification of a
main parameter value.
4.2 Results with Variability
4.2.1 Range and Delta Graphs
In Fig. 2, the GWP results of the 3000 simulations are plotted for the compared
systems against the total logistic distance, i.e. the most influencing parameter for the
crate system. In this “Range graph”, a cloud of points is represented for each
system. The slope of the trendline indicates how much the results depend on the
parameter taken as x-as. The height of the cloud of points reflects the remaining
variability, i.e. the variability that is not explained by this main parameter.
For comparing two systems, the relative positions of both clouds of points is
analysed. In Fig. 2, the clouds overlap partially. Hence, it is difficult to determine in
which situations the corrugated boxes have higher impacts than the crates.
In order to eliminate the common variability of the compared systems, the results
of each simulation can be compared two by two. The differences between both
systems calculated for all simulations can be plotted in a “Delta graph”, represented
in Fig. 3. The analysis of delta results indicates that corrugated boxes are better in
Fig. 1 GWP results for the comparison of average cases—detail per life cycle steps
346
C. Alexandre et al.
corrugated box for the average scenario. It also highlights the most contributing
phases. However, such result presentation does not reflect the uncertainty nor
provides indication on how would the results evolve in case of a modification of a
main parameter value.
4.2 Results with Variability
4.2.1 Range and Delta Graphs
In Fig. 2, the GWP results of the 3000 simulations are plotted for the compared
systems against the total logistic distance, i.e. the most influencing parameter for the
crate system. In this “Range graph”, a cloud of points is represented for each
system. The slope of the trendline indicates how much the results depend on the
parameter taken as x-as. The height of the cloud of points reflects the remaining
variability, i.e. the variability that is not explained by this main parameter.
For comparing two systems, the relative positions of both clouds of points is
analysed. In Fig. 2, the clouds overlap partially. Hence, it is difficult to determine in
which situations the corrugated boxes have higher impacts than the crates.
In order to eliminate the common variability of the compared systems, the results
of each simulation can be compared two by two. The differences between both
systems calculated for all simulations can be plotted in a “Delta graph”, represented
in Fig. 3. The analysis of delta results indicates that corrugated boxes are better in
Fig. 1 GWP results for the comparison of average cases—detail per life cycle steps
346
C. Alexandre et al.