

3% of the cases studied, as can also be calculated by other software tools. However,
the delta graph provides much richer information. It allows drawing specific conclusions for defined ranges of parameter values. In Fig. 3, it appears that up to a
distance of 900 km, the corrugated boxes always have higher GWP impacts than
plastic crates (“always” means that the conclusion is drawn while keeping all
parameters variable or uncertain).
4.2.2 Areas of Relevance
The residual variability, beside the one related to the most influential parameter, can be
further analysed by looking at a second parameter, for example here the height of the
cases. Small incremental ranges of values are defined for both variable parameters (for
example, ranges of 1 cm of height). The results obtained for each combination of
height and distance ranges are averaged and compared for both systems. The obtained
impact ratios (or indexes) can be represented for all situations, as in Fig. 4, with the
level of grey being related to the index (number inside the cells). Conclusions can be
drawn within areas of relevance. With an index lower than 1, the light grey cells
signify that the plastic crates have a lower impact (the crate is the best solution). The
darker the cell, the higher the index. With index above 1, the corrugated boxes have a
lower impact (the box is the best solution). A buffer zone is represented in intermediate
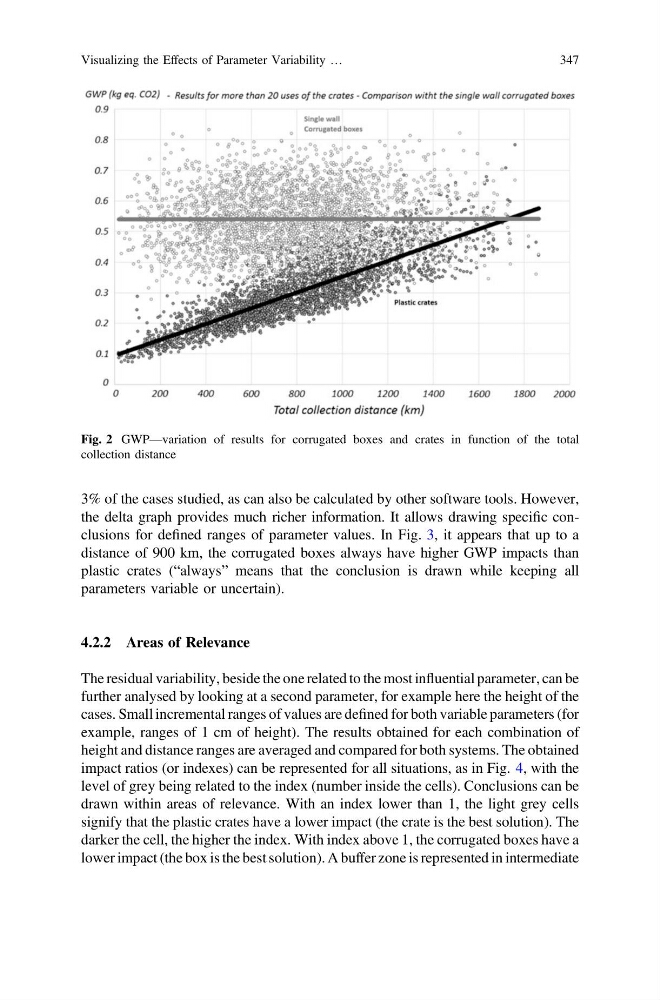
Fig. 2 GWP—variation of results for corrugated boxes and crates in function of the total
collection distance
Visualizing the Effects of Parameter Variability …
347
the delta graph provides much richer information. It allows drawing specific conclusions for defined ranges of parameter values. In Fig. 3, it appears that up to a
distance of 900 km, the corrugated boxes always have higher GWP impacts than
plastic crates (“always” means that the conclusion is drawn while keeping all
parameters variable or uncertain).
4.2.2 Areas of Relevance
The residual variability, beside the one related to the most influential parameter, can be
further analysed by looking at a second parameter, for example here the height of the
cases. Small incremental ranges of values are defined for both variable parameters (for
example, ranges of 1 cm of height). The results obtained for each combination of
height and distance ranges are averaged and compared for both systems. The obtained
impact ratios (or indexes) can be represented for all situations, as in Fig. 4, with the
level of grey being related to the index (number inside the cells). Conclusions can be
drawn within areas of relevance. With an index lower than 1, the light grey cells
signify that the plastic crates have a lower impact (the crate is the best solution). The
darker the cell, the higher the index. With index above 1, the corrugated boxes have a
lower impact (the box is the best solution). A buffer zone is represented in intermediate
Fig. 2 GWP—variation of results for corrugated boxes and crates in function of the total
collection distance
Visualizing the Effects of Parameter Variability …
347