

3 RangeLCA Software
RangeLCA is the own LCA software developed by RDC Environment since the
early 90s. It is used here to perform the sensitivity analysis and to propose innovative ways of presenting the variable results.
For every parameter, a probability distribution can be defined to express the
parameter variability (either originating in uncertainty or in diversity of situations).
Normal, lognormal, uniform, triangular and discrete distributions are available in the
software, as well as any mathematically defined distribution. In the case study, a
uniform distribution of probability is modelled within the ranges defined by the
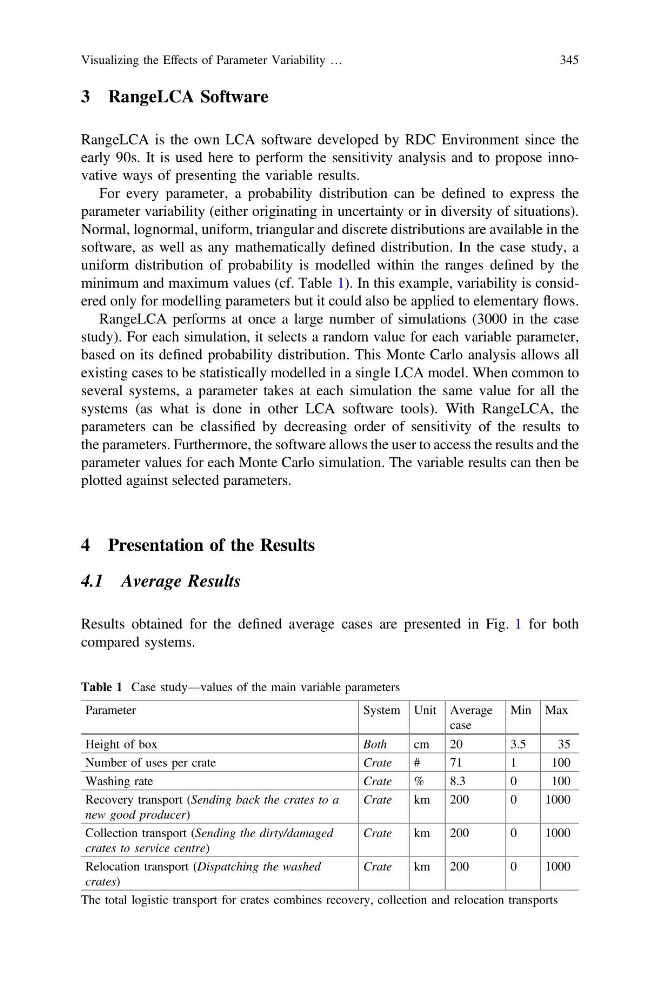
minimum and maximum values (cf. Table 1). In this example, variability is considered only for modelling parameters but it could also be applied to elementary flows.
RangeLCA performs at once a large number of simulations (3000 in the case
study). For each simulation, it selects a random value for each variable parameter,
based on its defined probability distribution. This Monte Carlo analysis allows all
existing cases to be statistically modelled in a single LCA model. When common to
several systems, a parameter takes at each simulation the same value for all the
systems (as what is done in other LCA software tools). With RangeLCA, the
parameters can be classified by decreasing order of sensitivity of the results to
the parameters. Furthermore, the software allows the user to access the results and the
parameter values for each Monte Carlo simulation. The variable results can then be
plotted against selected parameters.
4 Presentation of the Results
4.1 Average Results
Results obtained for the defined average cases are presented in Fig. 1 for both
compared systems.
Table 1 Case study—values of the main variable parameters
Parameter
System Unit Average
case
Min Max
Height of box
Both
cm
20
3.5
35
Number of uses per crate
Crate
#
71
1
100
Washing rate
Crate
%
8.3
0
100
Recovery transport (Sending back the crates to a
new good producer)
Crate
km
200
0
1000
Collection transport (Sending the dirty/damaged
crates to service centre)
Crate
km
200
0
1000
Relocation transport (Dispatching the washed
crates)
Crate
km
200
0
1000
The total logistic transport for crates combines recovery, collection and relocation transports
Visualizing the Effects of Parameter Variability …
345
RangeLCA is the own LCA software developed by RDC Environment since the
early 90s. It is used here to perform the sensitivity analysis and to propose innovative ways of presenting the variable results.
For every parameter, a probability distribution can be defined to express the
parameter variability (either originating in uncertainty or in diversity of situations).
Normal, lognormal, uniform, triangular and discrete distributions are available in the
software, as well as any mathematically defined distribution. In the case study, a
uniform distribution of probability is modelled within the ranges defined by the
minimum and maximum values (cf. Table 1). In this example, variability is considered only for modelling parameters but it could also be applied to elementary flows.
RangeLCA performs at once a large number of simulations (3000 in the case
study). For each simulation, it selects a random value for each variable parameter,
based on its defined probability distribution. This Monte Carlo analysis allows all
existing cases to be statistically modelled in a single LCA model. When common to
several systems, a parameter takes at each simulation the same value for all the
systems (as what is done in other LCA software tools). With RangeLCA, the
parameters can be classified by decreasing order of sensitivity of the results to
the parameters. Furthermore, the software allows the user to access the results and the
parameter values for each Monte Carlo simulation. The variable results can then be
plotted against selected parameters.
4 Presentation of the Results
4.1 Average Results
Results obtained for the defined average cases are presented in Fig. 1 for both
compared systems.
Table 1 Case study—values of the main variable parameters
Parameter
System Unit Average
case
Min Max
Height of box
Both
cm
20
3.5
35
Number of uses per crate
Crate
#
71
1
100
Washing rate
Crate
%
8.3
0
100
Recovery transport (Sending back the crates to a
new good producer)
Crate
km
200
0
1000
Collection transport (Sending the dirty/damaged
crates to service centre)
Crate
km
200
0
1000
Relocation transport (Dispatching the washed
crates)
Crate
km
200
0
1000
The total logistic transport for crates combines recovery, collection and relocation transports
Visualizing the Effects of Parameter Variability …
345