

Addressing enteric fermentation (B)
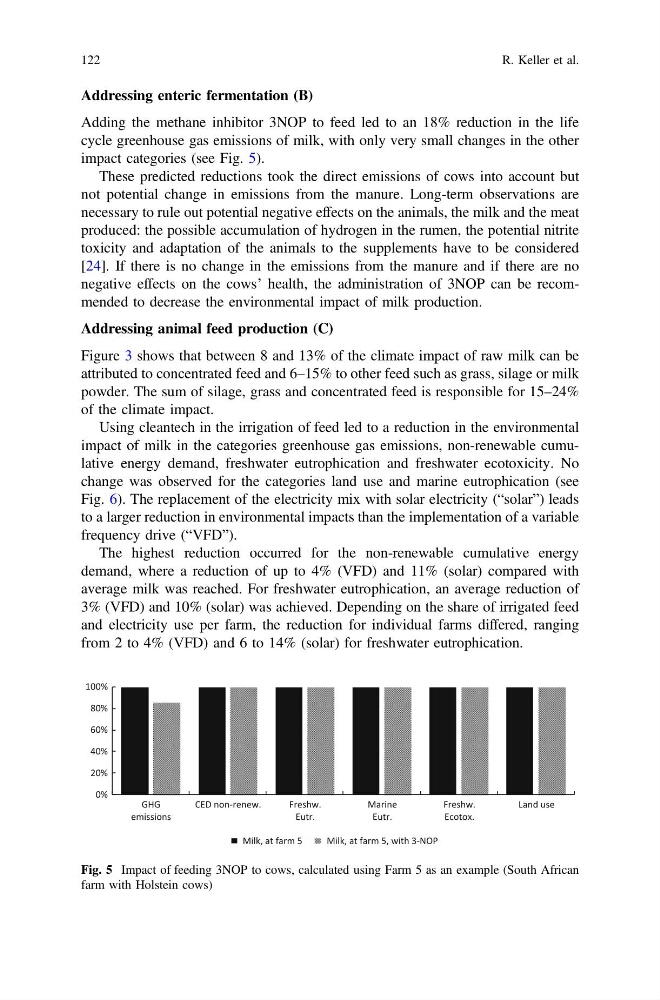
Adding the methane inhibitor 3NOP to feed led to an 18% reduction in the life
cycle greenhouse gas emissions of milk, with only very small changes in the other
impact categories (see Fig. 5).
These predicted reductions took the direct emissions of cows into account but
not potential change in emissions from the manure. Long-term observations are
necessary to rule out potential negative effects on the animals, the milk and the meat
produced: the possible accumulation of hydrogen in the rumen, the potential nitrite
toxicity and adaptation of the animals to the supplements have to be considered
[24]. If there is no change in the emissions from the manure and if there are no
negative effects on the cows’ health, the administration of 3NOP can be recommended to decrease the environmental impact of milk production.
Addressing animal feed production (C)
Figure 3 shows that between 8 and 13% of the climate impact of raw milk can be
attributed to concentrated feed and 6–15% to other feed such as grass, silage or milk
powder. The sum of silage, grass and concentrated feed is responsible for 15–24%
of the climate impact.
Using cleantech in the irrigation of feed led to a reduction in the environmental
impact of milk in the categories greenhouse gas emissions, non-renewable cumulative energy demand, freshwater eutrophication and freshwater ecotoxicity. No
change was observed for the categories land use and marine eutrophication (see
Fig. 6). The replacement of the electricity mix with solar electricity (“solar”) leads
to a larger reduction in environmental impacts than the implementation of a variable
frequency drive (“VFD”).
The highest reduction occurred for the non-renewable cumulative energy
demand, where a reduction of up to 4% (VFD) and 11% (solar) compared with
average milk was reached. For freshwater eutrophication, an average reduction of
3% (VFD) and 10% (solar) was achieved. Depending on the share of irrigated feed
and electricity use per farm, the reduction for individual farms differed, ranging
from 2 to 4% (VFD) and 6 to 14% (solar) for freshwater eutrophication.
0%
20%
40%
60%
80%
100%
GHG
emissions
CED non-renew.
Freshw.
Eutr.
Marine
Eutr.
Freshw.
Ecotox.
Land use
Milk, at farm 5
Milk, at farm 5, with 3-NOP
Fig. 5 Impact of feeding 3NOP to cows, calculated using Farm 5 as an example (South African
farm with Holstein cows)
122
R. Keller et al.
Adding the methane inhibitor 3NOP to feed led to an 18% reduction in the life
cycle greenhouse gas emissions of milk, with only very small changes in the other
impact categories (see Fig. 5).
These predicted reductions took the direct emissions of cows into account but
not potential change in emissions from the manure. Long-term observations are
necessary to rule out potential negative effects on the animals, the milk and the meat
produced: the possible accumulation of hydrogen in the rumen, the potential nitrite
toxicity and adaptation of the animals to the supplements have to be considered
[24]. If there is no change in the emissions from the manure and if there are no
negative effects on the cows’ health, the administration of 3NOP can be recommended to decrease the environmental impact of milk production.
Addressing animal feed production (C)
Figure 3 shows that between 8 and 13% of the climate impact of raw milk can be
attributed to concentrated feed and 6–15% to other feed such as grass, silage or milk
powder. The sum of silage, grass and concentrated feed is responsible for 15–24%
of the climate impact.
Using cleantech in the irrigation of feed led to a reduction in the environmental
impact of milk in the categories greenhouse gas emissions, non-renewable cumulative energy demand, freshwater eutrophication and freshwater ecotoxicity. No
change was observed for the categories land use and marine eutrophication (see
Fig. 6). The replacement of the electricity mix with solar electricity (“solar”) leads
to a larger reduction in environmental impacts than the implementation of a variable
frequency drive (“VFD”).
The highest reduction occurred for the non-renewable cumulative energy
demand, where a reduction of up to 4% (VFD) and 11% (solar) compared with
average milk was reached. For freshwater eutrophication, an average reduction of
3% (VFD) and 10% (solar) was achieved. Depending on the share of irrigated feed
and electricity use per farm, the reduction for individual farms differed, ranging
from 2 to 4% (VFD) and 6 to 14% (solar) for freshwater eutrophication.
0%
20%
40%
60%
80%
100%
GHG
emissions
CED non-renew.
Freshw.
Eutr.
Marine
Eutr.
Freshw.
Ecotox.
Land use
Milk, at farm 5
Milk, at farm 5, with 3-NOP
Fig. 5 Impact of feeding 3NOP to cows, calculated using Farm 5 as an example (South African
farm with Holstein cows)
122
R. Keller et al.