

46
5 Analysis
from polycrystalline samples [2] to toroidal single crystals [4, 5]. Yaraskavitch et al.
established that the time constants τ M (T ) measured from SQUID-based susceptibility measurements of rod shaped samples were in good qualitative agreement with
τ M (T ) reported in both in Snyder et al. and Matsuhira et al. Eyvazov et al. verified
quantitative agreement between τ M (T ) from their susceptibility measurements and
τ M (T ) from Yaraskavitch et al.
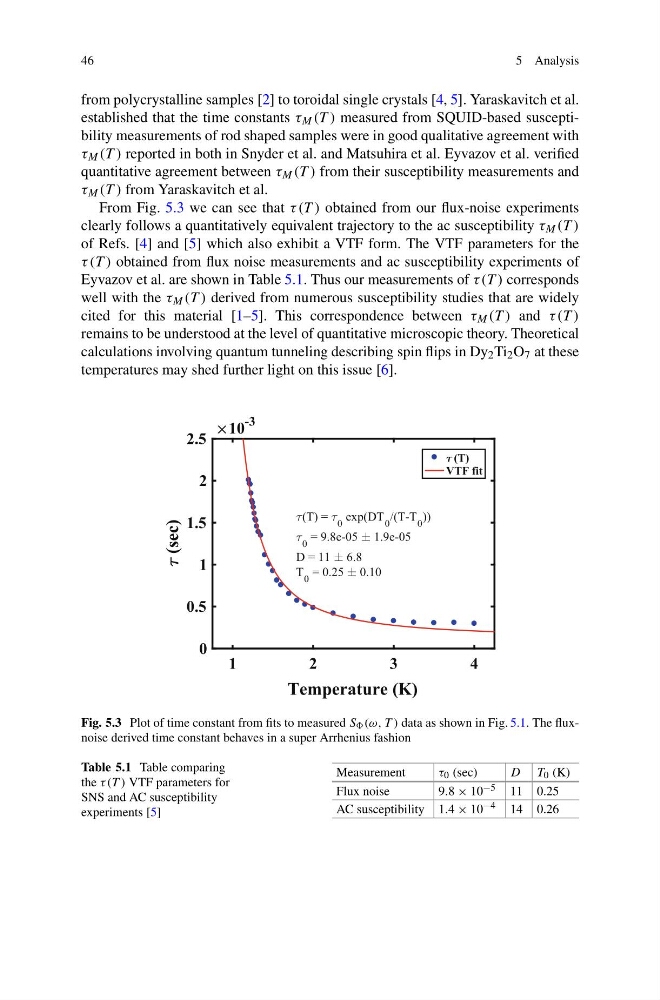
From Fig. 5.3 we can see that τ (T ) obtained from our flux-noise experiments
clearly follows a quantitatively equivalent trajectory to the ac susceptibility τ M (T )
of Refs. [4] and [5] which also exhibit a VTF form. The VTF parameters for the
τ (T ) obtained from flux noise measurements and ac susceptibility experiments of
Eyvazov et al. are shown in Table 5.1. Thus our measurements of τ (T ) corresponds
well with the τ M (T ) derived from numerous susceptibility studies that are widely
cited for this material [1–5]. This correspondence between τ M (T ) and τ (T )
remains to be understood at the level of quantitative microscopic theory. Theoretical
calculations involving quantum tunneling describing spin flips in Dy 2 Ti 2 O 7 at these
temperatures may shed further light on this issue [6].
1
2
3
4
Temperature (K)
0
0.5
1
1.5
2
2.5
(sec)
10
-3
(T)
VTF fit
(T) = 0 exp(DT 0 /(T-T 0 ))
0
= 9.8e-05 1.9e-05
D = 11 6.8
T 0
= 0.25 0.10
Fig. 5.3 Plot of time constant from fits to measured S (ω, T ) data as shown in Fig. 5.1. The fluxnoise derived time constant behaves in a super Arrhenius fashion
Table 5.1 Table comparing
the τ (T ) VTF parameters for
SNS and AC susceptibility
experiments [5]
Measurement
τ 0 (sec)
D T 0 (K)
Flux noise
9.8 × 10 −5 11 0.25
AC susceptibility 1.4 × 10 −4 14 0.26
5 Analysis
from polycrystalline samples [2] to toroidal single crystals [4, 5]. Yaraskavitch et al.
established that the time constants τ M (T ) measured from SQUID-based susceptibility measurements of rod shaped samples were in good qualitative agreement with
τ M (T ) reported in both in Snyder et al. and Matsuhira et al. Eyvazov et al. verified
quantitative agreement between τ M (T ) from their susceptibility measurements and
τ M (T ) from Yaraskavitch et al.
From Fig. 5.3 we can see that τ (T ) obtained from our flux-noise experiments
clearly follows a quantitatively equivalent trajectory to the ac susceptibility τ M (T )
of Refs. [4] and [5] which also exhibit a VTF form. The VTF parameters for the
τ (T ) obtained from flux noise measurements and ac susceptibility experiments of
Eyvazov et al. are shown in Table 5.1. Thus our measurements of τ (T ) corresponds
well with the τ M (T ) derived from numerous susceptibility studies that are widely
cited for this material [1–5]. This correspondence between τ M (T ) and τ (T )
remains to be understood at the level of quantitative microscopic theory. Theoretical
calculations involving quantum tunneling describing spin flips in Dy 2 Ti 2 O 7 at these
temperatures may shed further light on this issue [6].
1
2
3
4
Temperature (K)
0
0.5
1
1.5
2
2.5
(sec)
10
-3
(T)
VTF fit
(T) = 0 exp(DT 0 /(T-T 0 ))
0
= 9.8e-05 1.9e-05
D = 11 6.8
T 0
= 0.25 0.10
Fig. 5.3 Plot of time constant from fits to measured S (ω, T ) data as shown in Fig. 5.1. The fluxnoise derived time constant behaves in a super Arrhenius fashion
Table 5.1 Table comparing
the τ (T ) VTF parameters for
SNS and AC susceptibility
experiments [5]
Measurement
τ 0 (sec)
D T 0 (K)
Flux noise
9.8 × 10 −5 11 0.25
AC susceptibility 1.4 × 10 −4 14 0.26