

5.2 Extraction of Time Constant
45
10
2
10
3
10
4
(rad/sec)
0
0.2
0.4
0.6
0.8
1
1.2
S ( ) / S ( =0)
1.2
1.23
1.26
1.29
1.32
1.35
1.4
1.45
1.5
1.55
1.6
1.7
1.8
2
2.25
2.5
3
3.5
4
Temperature (K)
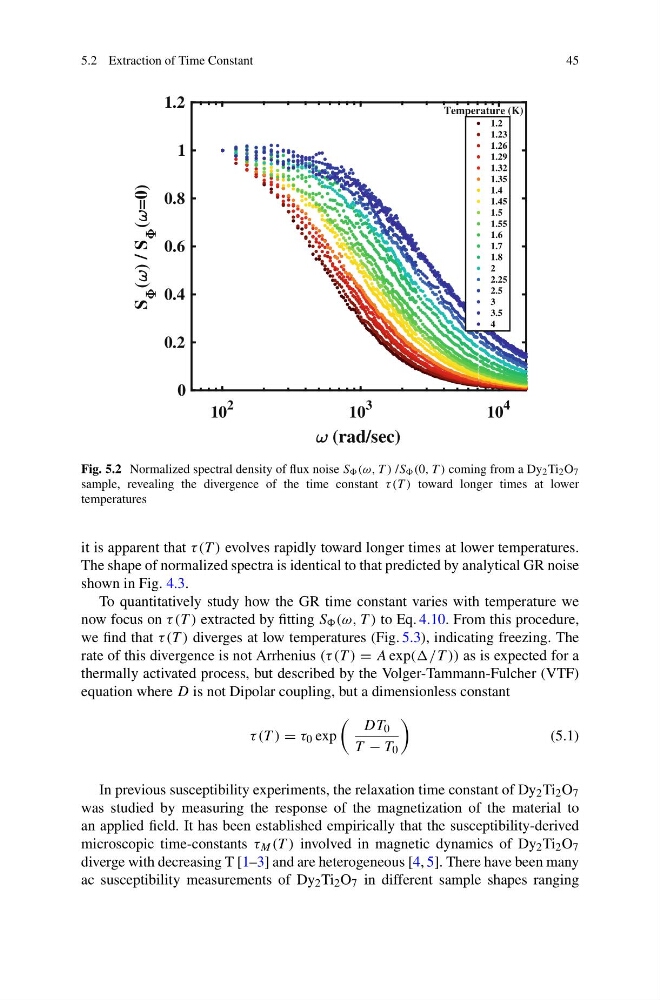
Fig. 5.2 Normalized spectral density of flux noise S (ω, T ) /S (0, T ) coming from a Dy 2 Ti 2 O 7
sample, revealing the divergence of the time constant τ (T ) toward longer times at lower
temperatures
it is apparent that τ (T ) evolves rapidly toward longer times at lower temperatures.
The shape of normalized spectra is identical to that predicted by analytical GR noise
shown in Fig. 4.3.
To quantitatively study how the GR time constant varies with temperature we
now focus on τ (T ) extracted by fitting S (ω, T ) to Eq. 4.10. From this procedure,
we find that τ (T ) diverges at low temperatures (Fig. 5.3), indicating freezing. The
rate of this divergence is not Arrhenius (τ (T ) = A exp((/T )) as is expected for a
thermally activated process, but described by the Volger-Tammann-Fulcher (VTF)
equation where D is not Dipolar coupling, but a dimensionless constant
τ (T ) = τ 0 exp
DT 0
T − T 0
(5.1)
In previous susceptibility experiments, the relaxation time constant of Dy 2 Ti 2 O 7
was studied by measuring the response of the magnetization of the material to
an applied field. It has been established empirically that the susceptibility-derived
microscopic time-constants τ M (T ) involved in magnetic dynamics of Dy 2 Ti 2 O 7
diverge with decreasing T [1–3] and are heterogeneous [4, 5]. There have been many
ac susceptibility measurements of Dy 2 Ti 2 O 7 in different sample shapes ranging
45
10
2
10
3
10
4
(rad/sec)
0
0.2
0.4
0.6
0.8
1
1.2
S ( ) / S ( =0)
1.2
1.23
1.26
1.29
1.32
1.35
1.4
1.45
1.5
1.55
1.6
1.7
1.8
2
2.25
2.5
3
3.5
4
Temperature (K)
Fig. 5.2 Normalized spectral density of flux noise S (ω, T ) /S (0, T ) coming from a Dy 2 Ti 2 O 7
sample, revealing the divergence of the time constant τ (T ) toward longer times at lower
temperatures
it is apparent that τ (T ) evolves rapidly toward longer times at lower temperatures.
The shape of normalized spectra is identical to that predicted by analytical GR noise
shown in Fig. 4.3.
To quantitatively study how the GR time constant varies with temperature we
now focus on τ (T ) extracted by fitting S (ω, T ) to Eq. 4.10. From this procedure,
we find that τ (T ) diverges at low temperatures (Fig. 5.3), indicating freezing. The
rate of this divergence is not Arrhenius (τ (T ) = A exp((/T )) as is expected for a
thermally activated process, but described by the Volger-Tammann-Fulcher (VTF)
equation where D is not Dipolar coupling, but a dimensionless constant
τ (T ) = τ 0 exp
DT 0
T − T 0
(5.1)
In previous susceptibility experiments, the relaxation time constant of Dy 2 Ti 2 O 7
was studied by measuring the response of the magnetization of the material to
an applied field. It has been established empirically that the susceptibility-derived
microscopic time-constants τ M (T ) involved in magnetic dynamics of Dy 2 Ti 2 O 7
diverge with decreasing T [1–3] and are heterogeneous [4, 5]. There have been many
ac susceptibility measurements of Dy 2 Ti 2 O 7 in different sample shapes ranging