

30
3 Experiment
10
-3
10
-2
10
-1
10
0
(MC steps)
-1
0
0.5
1
1.5
2
2.5
S
B
z
( ) (T
2
/Hz)
10
-19
1
1.1
1.2
1.3
1.4
1.5
1.6
1.7
1.8
1.9
2
2.25
2.5
2.75
3
3.5
4
Temperature (K)
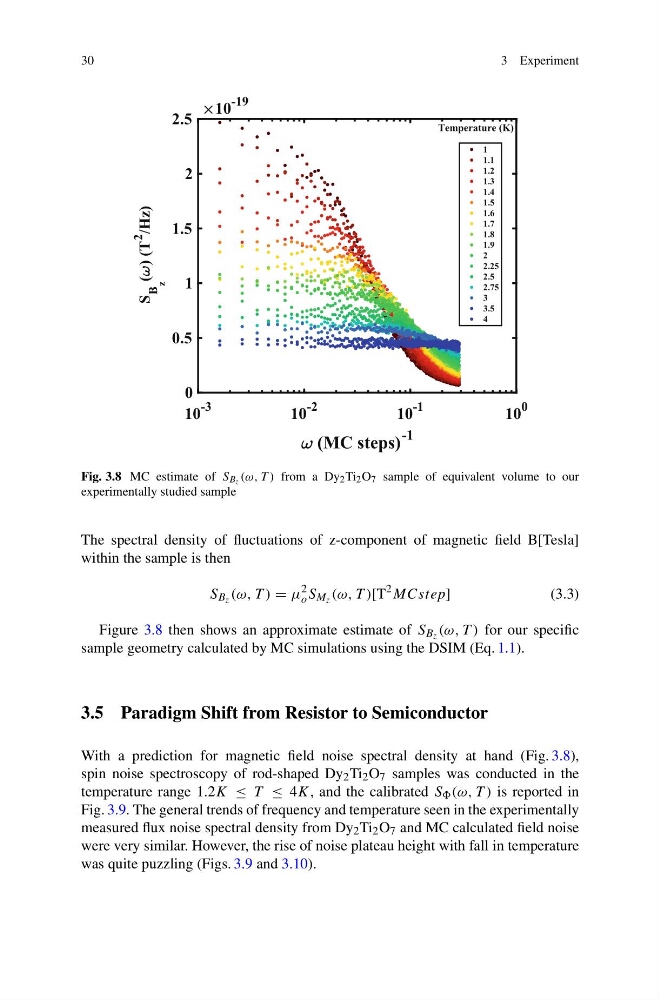
Fig. 3.8 MC estimate of S Bz (ω, T ) from a Dy 2 Ti 2 O 7 sample of equivalent volume to our
experimentally studied sample
The spectral density of fluctuations of z-component of magnetic field B[Tesla]
within the sample is then
S B z (ω, T ) = μ
2
o S M z (ω, T )[T
2 MCstep]
(3.3)
Figure 3.8 then shows an approximate estimate of S B z (ω, T ) for our specific
sample geometry calculated by MC simulations using the DSIM (Eq. 1.1).
3.5 Paradigm Shift from Resistor to Semiconductor
With a prediction for magnetic field noise spectral density at hand (Fig. 3.8),
spin noise spectroscopy of rod-shaped Dy 2 Ti 2 O 7 samples was conducted in the
temperature range 1.2K ≤ T ≤ 4K, and the calibrated S (ω, T ) is reported in
Fig. 3.9. The general trends of frequency and temperature seen in the experimentally
measured flux noise spectral density from Dy 2 Ti 2 O 7 and MC calculated field noise
were very similar. However, the rise of noise plateau height with fall in temperature
was quite puzzling (Figs. 3.9 and 3.10).
3 Experiment
10
-3
10
-2
10
-1
10
0
(MC steps)
-1
0
0.5
1
1.5
2
2.5
S
B
z
( ) (T
2
/Hz)
10
-19
1
1.1
1.2
1.3
1.4
1.5
1.6
1.7
1.8
1.9
2
2.25
2.5
2.75
3
3.5
4
Temperature (K)
Fig. 3.8 MC estimate of S Bz (ω, T ) from a Dy 2 Ti 2 O 7 sample of equivalent volume to our
experimentally studied sample
The spectral density of fluctuations of z-component of magnetic field B[Tesla]
within the sample is then
S B z (ω, T ) = μ
2
o S M z (ω, T )[T
2 MCstep]
(3.3)
Figure 3.8 then shows an approximate estimate of S B z (ω, T ) for our specific
sample geometry calculated by MC simulations using the DSIM (Eq. 1.1).
3.5 Paradigm Shift from Resistor to Semiconductor
With a prediction for magnetic field noise spectral density at hand (Fig. 3.8),
spin noise spectroscopy of rod-shaped Dy 2 Ti 2 O 7 samples was conducted in the
temperature range 1.2K ≤ T ≤ 4K, and the calibrated S (ω, T ) is reported in
Fig. 3.9. The general trends of frequency and temperature seen in the experimentally
measured flux noise spectral density from Dy 2 Ti 2 O 7 and MC calculated field noise
were very similar. However, the rise of noise plateau height with fall in temperature
was quite puzzling (Figs. 3.9 and 3.10).