

3.5 Paradigm Shift from Resistor to Semiconductor
31
10
2
10
3
10
4
(rad/sec)
0
0.2
0.4
0.6
0.8
1
S ( ) (
0
2
/Hz)
10
-4
0
1
2
S
B
z
( ) (T
2
/Hz)
10
-22
1.2
1.23
1.26
1.29
1.32
1.35
1.4
1.45
1.5
1.55
1.6
1.7
1.8
2
2.25
2.5
3
3.5
4
Temperature (K)
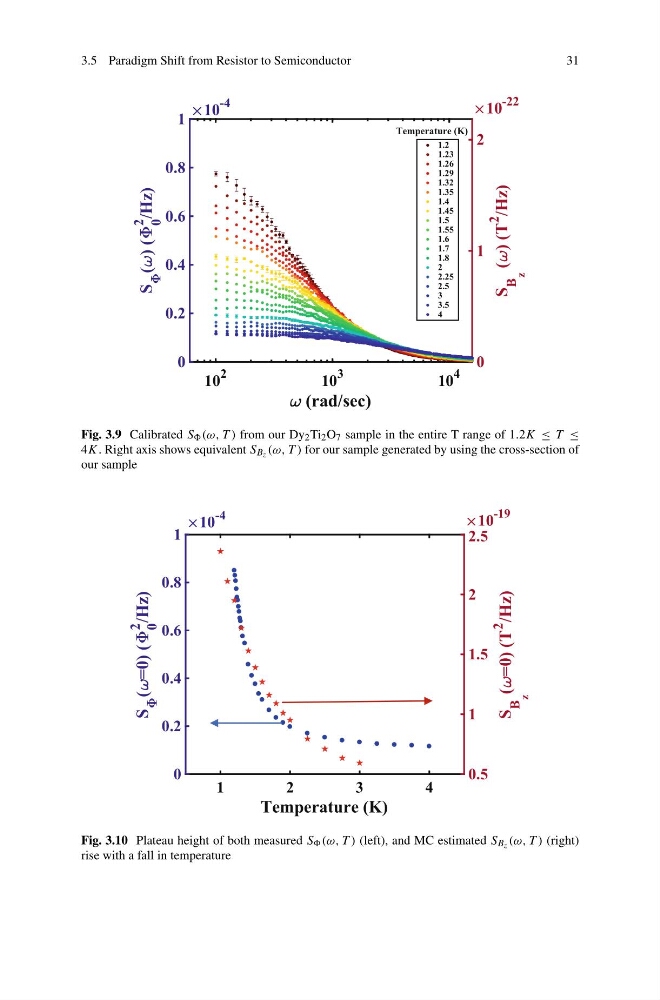
Fig. 3.9 Calibrated S (ω, T ) from our Dy 2 Ti 2 O 7 sample in the entire T range of 1.2K ≤ T ≤
4K. Right axis shows equivalent S Bz (ω, T ) for our sample generated by using the cross-section of
our sample
1
2
3
4
Temperature (K)
0
0.2
0.4
0.6
0.8
1
S ( =0) (
0
2
/Hz)
10
-4
0.5
1
1.5
2
2.5
( =0) (T
2
/Hz)
10
-19
S
B
z
Fig. 3.10 Plateau height of both measured S (ω, T ) (left), and MC estimated S Bz (ω, T ) (right)
rise with a fall in temperature
31
10
2
10
3
10
4
(rad/sec)
0
0.2
0.4
0.6
0.8
1
S ( ) (
0
2
/Hz)
10
-4
0
1
2
S
B
z
( ) (T
2
/Hz)
10
-22
1.2
1.23
1.26
1.29
1.32
1.35
1.4
1.45
1.5
1.55
1.6
1.7
1.8
2
2.25
2.5
3
3.5
4
Temperature (K)
Fig. 3.9 Calibrated S (ω, T ) from our Dy 2 Ti 2 O 7 sample in the entire T range of 1.2K ≤ T ≤
4K. Right axis shows equivalent S Bz (ω, T ) for our sample generated by using the cross-section of
our sample
1
2
3
4
Temperature (K)
0
0.2
0.4
0.6
0.8
1
S ( =0) (
0
2
/Hz)
10
-4
0.5
1
1.5
2
2.5
( =0) (T
2
/Hz)
10
-19
S
B
z
Fig. 3.10 Plateau height of both measured S (ω, T ) (left), and MC estimated S Bz (ω, T ) (right)
rise with a fall in temperature