

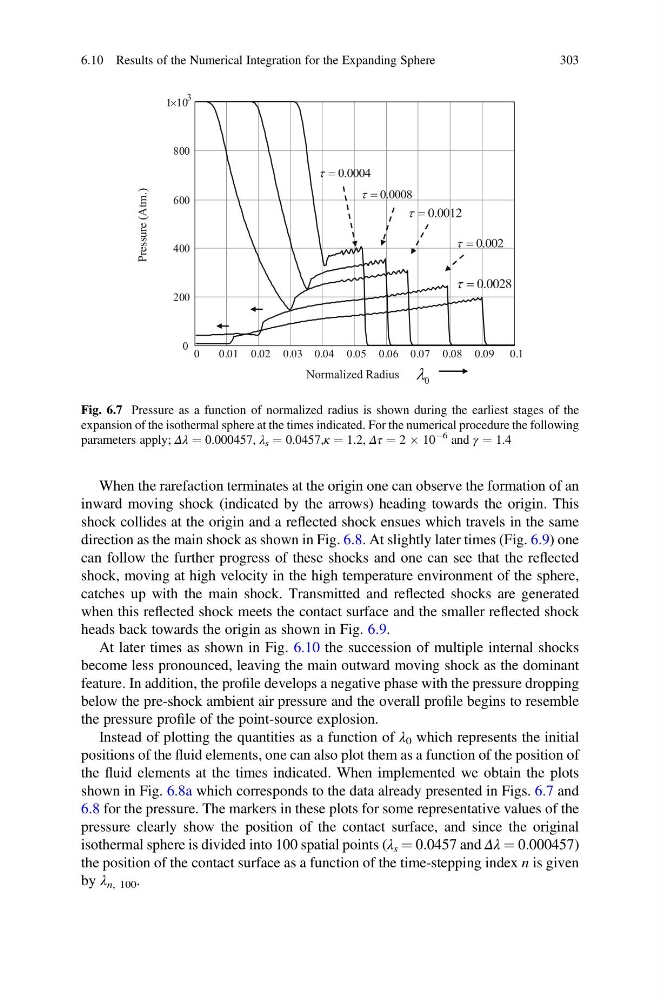
When the rarefaction terminates at the origin one can observe the formation of an
inward moving shock (indicated by the arrows) heading towards the origin. This
shock collides at the origin and a reflected shock ensues which travels in the same
direction as the main shock as shown in Fig. 6.8. At slightly later times (Fig. 6.9) one
can follow the further progress of these shocks and one can see that the reflected
shock, moving at high velocity in the high temperature environment of the sphere,
catches up with the main shock. Transmitted and reflected shocks are generated
when this reflected shock meets the contact surface and the smaller reflected shock
heads back towards the origin as shown in Fig. 6.9.
At later times as shown in Fig. 6.10 the succession of multiple internal shocks
become less pronounced, leaving the main outward moving shock as the dominant
feature. In addition, the profile develops a negative phase with the pressure dropping
below the pre-shock ambient air pressure and the overall profile begins to resemble
the pressure profile of the point-source explosion.
Instead of plotting the quantities as a function of λ 0 which represents the initial
positions of the fluid elements, one can also plot them as a function of the position of
the fluid elements at the times indicated. When implemented we obtain the plots
shown in Fig. 6.8a which corresponds to the data already presented in Figs. 6.7 and
6.8 for the pressure. The markers in these plots for some representative values of the
pressure clearly show the position of the contact surface, and since the original
isothermal sphere is divided into 100 spatial points (λ s ¼ 0.0457 and Δλ ¼ 0.000457)
the position of the contact surface as a function of the time-stepping index n is given
by λ n, 100 .
Normalized Radius
Fig. 6.7 Pressure as a function of normalized radius is shown during the earliest stages of the
expansion of the isothermal sphere at the times indicated. For the numerical procedure the following
parameters apply; Δλ ¼ 0.000457, λ s ¼ 0.0457,κ ¼ 1.2, Δτ ¼ 2 Â 10
À6 and γ ¼ 1.4
6.10 Results of the Numerical Integration for the Expanding Sphere
303
inward moving shock (indicated by the arrows) heading towards the origin. This
shock collides at the origin and a reflected shock ensues which travels in the same
direction as the main shock as shown in Fig. 6.8. At slightly later times (Fig. 6.9) one
can follow the further progress of these shocks and one can see that the reflected
shock, moving at high velocity in the high temperature environment of the sphere,
catches up with the main shock. Transmitted and reflected shocks are generated
when this reflected shock meets the contact surface and the smaller reflected shock
heads back towards the origin as shown in Fig. 6.9.
At later times as shown in Fig. 6.10 the succession of multiple internal shocks
become less pronounced, leaving the main outward moving shock as the dominant
feature. In addition, the profile develops a negative phase with the pressure dropping
below the pre-shock ambient air pressure and the overall profile begins to resemble
the pressure profile of the point-source explosion.
Instead of plotting the quantities as a function of λ 0 which represents the initial
positions of the fluid elements, one can also plot them as a function of the position of
the fluid elements at the times indicated. When implemented we obtain the plots
shown in Fig. 6.8a which corresponds to the data already presented in Figs. 6.7 and
6.8 for the pressure. The markers in these plots for some representative values of the
pressure clearly show the position of the contact surface, and since the original
isothermal sphere is divided into 100 spatial points (λ s ¼ 0.0457 and Δλ ¼ 0.000457)
the position of the contact surface as a function of the time-stepping index n is given
by λ n, 100 .
Normalized Radius
Fig. 6.7 Pressure as a function of normalized radius is shown during the earliest stages of the
expansion of the isothermal sphere at the times indicated. For the numerical procedure the following
parameters apply; Δλ ¼ 0.000457, λ s ¼ 0.0457,κ ¼ 1.2, Δτ ¼ 2 Â 10
À6 and γ ¼ 1.4
6.10 Results of the Numerical Integration for the Expanding Sphere
303